The median US software developer earned $135,980 in May 2025, according to the BLS. On Levels.fyi's US software engineer page, updated in September 2026, median total compensation is $195,000.
That is a 43% difference before comparing two engineering roles. The sources are measuring different things: BLS reports employer-provided wages across the US economy, while Levels.fyi includes stock and bonuses and draws heavily from technology employers.
This distinction matters because many software engineer salary by role comparisons treat every published figure as interchangeable. They are not. Differences in seniority, employer mix, geography, job scope, and pay definition can produce a larger gap than the role itself.
The benchmarks below cover 14 common engineering roles. Each figure remains attached to its source and pay definition rather than being blended into a misleading "average." The Role Premium Stress Test later in the article shows how to decide whether an apparent salary premium belongs in your compensation structure.
The scope is salaries and employment costs, not contractor or outsourcing rates.
Motivated and focused experts for up to 60% less than locals, delivered in days, not months.
Software developer salaries by role in 2026
Three sources appear throughout the comparison:
BLS: Employer-reported median wages for the closest occupational code, measured in May 2025. Equity is excluded.
Stack Overflow (SO): Median self-reported total pay among 5,239 US compensation responses in the 2025 survey. The figure includes salary, bonuses, and perks before tax. Sample sizes for individual roles are not published.
Levels.fyi: US total compensation, including base salary, stock, and bonuses. Title pages were accessed in September 2026.
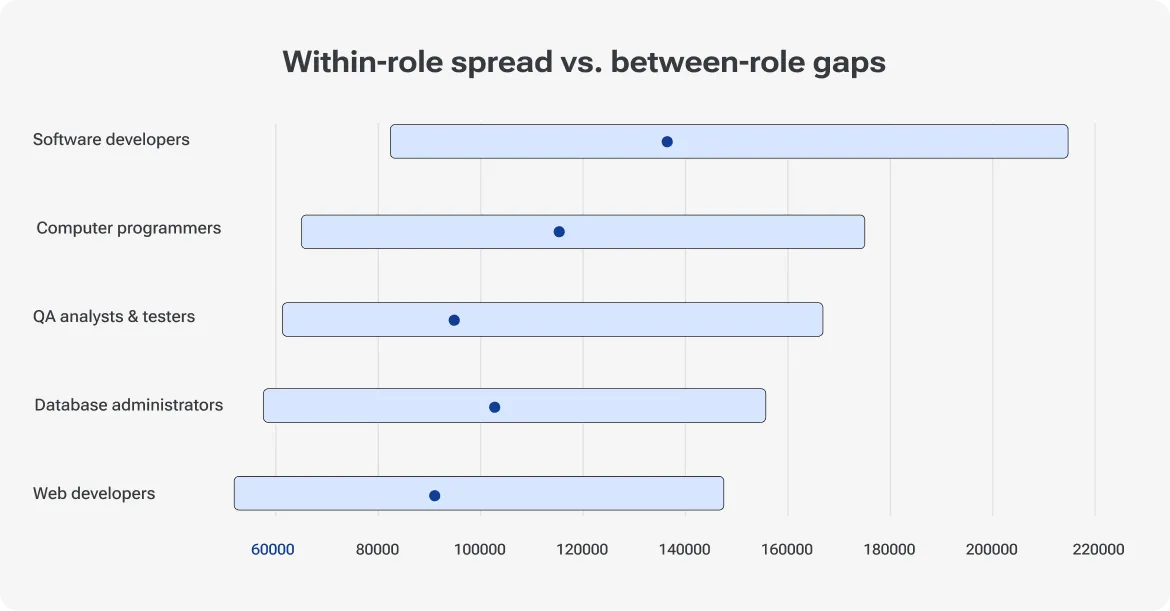
Even within the BLS software developer category, pay varies sharply. The bottom decile earns less than $82,460, while the top decile earns more than $214,670. The mean is $148,100, according to OEWS Table 1, or 9% above the median. That right-skewed distribution disappears when a role is represented by a single number.
Product engineering
Front-end developer: $145,000 in Stack Overflow's US data. BLS has no separate front-end occupation. Depending on how the employer classifies the job, it may fall under software developers or web developers, whose median is roughly 32% lower.
Back-end developer: $175,000 in Stack Overflow. The closest BLS category is the $135,980 software developer benchmark.
Full-stack developer: $138,000 in Stack Overflow, the lowest median among its core US developer titles. The category combines agency generalists, startup developers, and senior product engineers, which makes the figure difficult to interpret as a consistent market rate.
Mobile developer: $170,000 in Stack Overflow. The survey does not separate native iOS and Android specialists from cross-platform developers.
Infrastructure
DevOps engineer: $165,000 in Stack Overflow. The closest BLS occupation, network and computer systems administrators, has a $99,130 median wage. It is an imperfect mapping rather than an equivalent role.
Site reliability or platform engineer: $330,000 on the Levels.fyi SRE page. Neither BLS nor Stack Overflow provides a directly comparable category.
Data and AI
Data engineer: $150,000 in Stack Overflow. BLS has no dedicated occupational code.
Machine learning or AI engineer: $189,500 in Stack Overflow and $305,000 on the Levels.fyi machine learning engineer page. BLS does not track ML engineers separately.
Quality and security
QA engineer or SDET: $104,300 for BLS software quality assurance analysts and testers. Stack Overflow does not publish a US figure for its "Developer, QA or test" category, so no estimate has been added.
Security engineer: $129,180 for BLS information security analysts in the Occupational Outlook Handbook, versus $150,000 for cybersecurity professionals in Stack Overflow.
Architecture and engineering leadership
Software or solutions architect: $180,000 in Stack Overflow. BLS does not have a dedicated occupation for either title.
Stack Overflow's "Developer, AI apps or physical AI" category is excluded because the survey does not provide a US-specific figure.
Why role salary sources disagree
Salary sources do more than collect data differently. They also disagree on what the jobs are.
BLS occupational codes do not reflect many titles now used by product and engineering teams. The OEWS taxonomy covers software developers, web developers, programmers, QA analysts, information security analysts, and a broad "computer occupations, all other" category. It does not isolate front-end, back-end, DevOps, SRE, platform, ML, or AI engineers.
The US Department of Labor recognized DevOps Engineer as an apprenticeable occupation in April 2025, but OEWS still has no corresponding wage line. A page claiming to show a "BLS median for DevOps engineers" is therefore substituting another occupation.
Employer classification creates further distortion. Computer programmers have a $100,390 BLS median, while web developers earn about 32% less than software developers. Similar work can appear under different codes depending on how the employer defines and reports the position.
Misattribution is common in secondary salary content. Some pages relabel the BLS data scientist or software developer median as an "ML engineer salary." Neither occupation measures ML engineers specifically.
Survey categories create another problem. Stack Overflow separates AI/ML engineers, applied scientists, data scientists, and developers working on AI applications. Its year-over-year chart provides no 2024 comparison for AI/ML engineers, so the current category effectively begins a new series rather than continuing a stable historical benchmark.
Then there is the definition of pay:
OEWS wages exclude non-production bonuses and overtime under the BLS pay terms.
Stack Overflow asks respondents to report salary, bonuses, and perks before tax.
Levels.fyi combines base salary, stock, and bonuses.
Job advertisements show the range an employer expects to offer, not what it eventually pays.
Reference periods also get mixed. A page published in 2026 may still cite May 2024 BLS data, while the current Occupational Outlook Handbook uses projections for 2025–2035.
For a defensible comparison, keep the source and pay definition constant. A cross-source gap may tell you more about methodology than about the market value of the role.
Level usually matters more than title
The spread within an occupation is much larger than the median difference between most engineering occupations. BLS data for May 2025 shows the following 10th-to-90th-percentile ranges:
Software developers: $82,460–$214,670, a 2.6x spread
QA analysts and testers: $61,440–$167,010, a 2.7x spread
Information security analysts: $75,090–$199,850, a 2.7x spread
Data scientists: $67,240–$199,130, a 3.0x spread
Computer and information systems managers: $107,550–$297,510, a 2.8x spread
For software developers alone, the distance between the 10th and 90th percentiles is $132,210. By comparison, the median gap between software developers and QA testers is $31,680. The difference between software developers and data scientists is $15,750. The within-role spread is four to eight times larger.
Levels.fyi's standardized ladder, which is most developed for software engineering, points in the same direction. Its 2025 data puts US median total compensation at $155,000 for entry-level engineers, $312,587 for senior engineers, and $457,500 for staff engineers. The senior generalist median is already higher than the headline ML engineer figure.
A senior front-end engineer can therefore out-earn a mid-level ML engineer at the same company. Before asking which role pays more, benchmark software developer salary by experience level.
Entry-level pay also appears to be under more pressure than senior compensation. Dice reported a second consecutive year of declines for technology professionals with two years of experience or less, including a 1.4% fall in 2024. That is one report rather than a complete market measure, but it supports the broader evidence of salary compression at the bottom of the ladder.
Front-end, back-end, full-stack, and mobile developer salaries
Stack Overflow's US data puts back-end developers at $175,000 and front-end developers at $145,000, producing a 21% front-end vs back-end developer salary gap.
It is tempting to interpret that as a scarcity premium. The available data cannot support that conclusion because the respondents are not matched by experience, employer, or company size.
Stack Overflow itself reported a more experienced 2025 sample: people managers accounted for 15% of respondents, up from 13%, which the survey attributed to increased participation from experienced professionals. Globally, front-end median pay rose 24% year over year and mobile pay rose 27.1%, compared with 15.1% for back-end developers. Annual changes of that size are unlikely to reflect salary movement alone; the composition of the sample probably contributed.
Full-stack's $138,000 median is even harder to turn into a compensation rule. A full-stack title can describe one developer maintaining a small application, an agency generalist moving between client projects, or a senior engineer responsible for several layers of a large product. The title does not establish comparable scope.
Mobile's $170,000 figure has a similar limitation. Without separate data for native and cross-platform development, an iOS specialist working on a high-revenue consumer product and a generalist maintaining a hybrid application sit in the same category.
Public career architecture suggests these roles often belong on one engineering ladder. Dropbox's career framework, for instance, uses a single Software Engineer track from IC1 through IC7 rather than separate front-end and back-end ladders.
Within this family, compensation is more likely to move with responsibility for production systems, application performance, accessibility, platform components, or a shared design system than with the title alone.
DevOps, SRE, platform, and cloud engineer salaries
Infrastructure titles cover unusually different kinds of work. "DevOps engineer" may refer to a systems administrator maintaining deployment scripts, an engineer building an internal platform, or an owner of production reliability across multiple services.
That range helps explain the gap between the closest BLS category and Stack Overflow. Network and computer systems administrators earn a $99,130 median, and BLS expects employment in that occupation to decline 4% between 2025 and 2035. Stack Overflow's US DevOps median is $165,000, or 66% higher. The figures describe overlapping but substantially different jobs.
Stack Overflow reports $189,000 for cloud infrastructure engineers, 15% more than for DevOps engineers. Production accountability and ownership of cloud architecture or infrastructure costs could justify part of that difference, but the survey does not control for scope or seniority. Employers should test the premium against their own job descriptions and offer data.
Does AI lower the cost of hiring engineers?
SRE usually sits closer to the software engineering ladder. Levels.fyi treats Site Reliability Engineer as a title within the Software Engineer family. Dropbox uses a Reliability Engineer track running from IC1 to IC7, parallel to its general software engineering ladder.
Employer tier overwhelms any simple SRE premium. At Google, Levels.fyi reports SRE compensation from $193,000 at L3 to $792,000 at L7 on its Google SRE page. The PNC SRE median is $85,800. Those figures share a title but not a labor market.
On-call responsibility is another genuine source of variation. BLS includes on-call pay in its wage definition, but none of the sources used here publishes on-call compensation by engineering role.
There is no single source in this dataset that measures both SRE and DevOps pay under one definition. Any SRE vs DevOps engineer salary differential built by comparing two separate sources would be unreliable.
Data engineering, data science, and AI role salaries
"Data and AI" is not one labor market. At minimum, it contains four distinct types of work:
Data engineer: $150,000 in Stack Overflow's US data
Data scientist: $120,230 in BLS data and $145,000 in Stack Overflow
Machine learning engineer: $305,000 on Levels.fyi and $189,500 for AI/ML engineers in Stack Overflow
AI engineer building LLM-based applications: $245,000 in the US, according to Levels.fyi's Q3 2025 report
BLS reports 262,440 data scientist jobs and projects 35% employment growth through 2035. Yet its $120,230 median is 12% below the software developer median, contradicting the familiar claim that data science automatically pays more. The BLS occupation includes analytics-heavy positions across industries, not only highly paid roles at technology companies.
Within Stack Overflow's US sample, the data engineer vs data scientist salary difference is only 3%.
AI and ML engineering does show a premium, but the cleanest evidence says that premium depends on level. Levels.fyi compared AI-focused and non-AI software engineers at equivalent career stages:
Entry level: 6.2% in 2025, down from 10.74%
Engineer: 11.9%, up slightly from 11.6%
Senior: 14.2%, almost unchanged from 14.3%
Staff: 18.7%, up from 15.8%
The premium increases with seniority and has narrowed for junior engineers. It is not stable enough to treat as a universal percentage. Levels.fyi's median AI engineer compensation peaked at $295,000 in March 2024, dropped to $228,500 by January 2025, and later recovered. Its report connected part of that volatility to high compensation packages from Facebook.
Will AI replace junior developers?
Other headline premiums contain their own biases. Dice reports a 17.7% AI premium while also noting that AI professionals are more likely to hold senior or management positions. Lightcast's 28% premium, or roughly $18,000, comes from job postings across the economy. Some 51% of postings requiring AI skills are outside IT and computer science.
An AI differential is defensible when the comparison holds level, employer tier, and scope constant. Applying the same uplift to every developer who uses AI tools is not.
QA engineer, SDET, and security engineer salaries
BLS reports a $104,300 median for software quality assurance analysts and testers, 23% below the software developer median. The occupation covers 186,740 jobs.
Stack Overflow provides no US figure for QA developers. Its global median is $57,443, the lowest among the developer types it reports, but that worldwide figure should not be compared directly with US compensation.
The QA engineer vs SDET salary difference is partly a career-architecture issue. Dropbox separates Quality Engineer and SDET roles, with both tracks running from IC2 through IC5. Its Software Engineer ladder continues to IC7. Even if entry pay overlaps, the shorter ladder limits long-term compensation.
The distinction is usually scope rather than test execution versus test automation. A quality role moves closer to the engineering ladder when it owns test infrastructure, framework architecture, CI integration, developer tooling, or production-quality signals.
Security roles fit public occupational data more cleanly:
BLS information security analysts earn a $129,180 median, with a range of $75,090 at the 10th percentile to $199,850 at the 90th.
BLS projects 21% employment growth through 2035.
Stack Overflow's US cybersecurity median is $150,000.
Dropbox's Security Engineer track extends from IC2 through IC6.
For security engineer vs software engineer salary, BLS places information security analysts 5% below software developers. Stack Overflow places US cybersecurity professionals 14% below back-end developers. Neither result means that every security engineer earns less. Product-embedded application security engineers, cloud security specialists, and SOC analysts may have very different scopes, but the available sources do not publish separate US figures for them.
Architect and engineering manager salaries
Computer and information systems managers earn a $175,140 BLS median across 685,800 jobs. The category includes engineering managers but also IT directors, CIOs, and CTOs, so it should not be treated as a precise engineering management benchmark.
Stack Overflow reports $200,000 for US engineering managers, the highest figure among developer roles below senior executives at $225,000. Architects report $180,000.
Levels.fyi puts US engineering manager total compensation at $358,000. Manager pay rose 9.64% in 2025, compared with 7.52% for staff engineers.
Software and solutions architects have no dedicated BLS occupational code. The nearest categories pay less than software developers: computer network architects have a $134,050 median, while database administrators and architects have a combined $126,760 median.
At highly compensated technology companies, the engineering manager vs staff engineer salary comparison often favors senior individual contributors. Levels.fyi reports median total compensation of $457,500 for staff engineers and $551,151 for principal engineers, both above the $358,000 engineering manager title median. The comparison is not perfectly matched because the manager figure includes several management levels.
At the upper end of the market, management compensation rises sharply. Levels.fyi's 2025 report lists $1,380,000 for OpenAI engineering managers and $1,135,150 at Databricks.
A large management premium at equivalent scope can encourage strong individual contributors to become managers for financial reasons rather than aptitude. Parallel ladders reduce that pressure. Dropbox's public model places an M3–M7 engineering management track beside individual-contributor ladders that reach IC7.
The Role Premium Stress Test
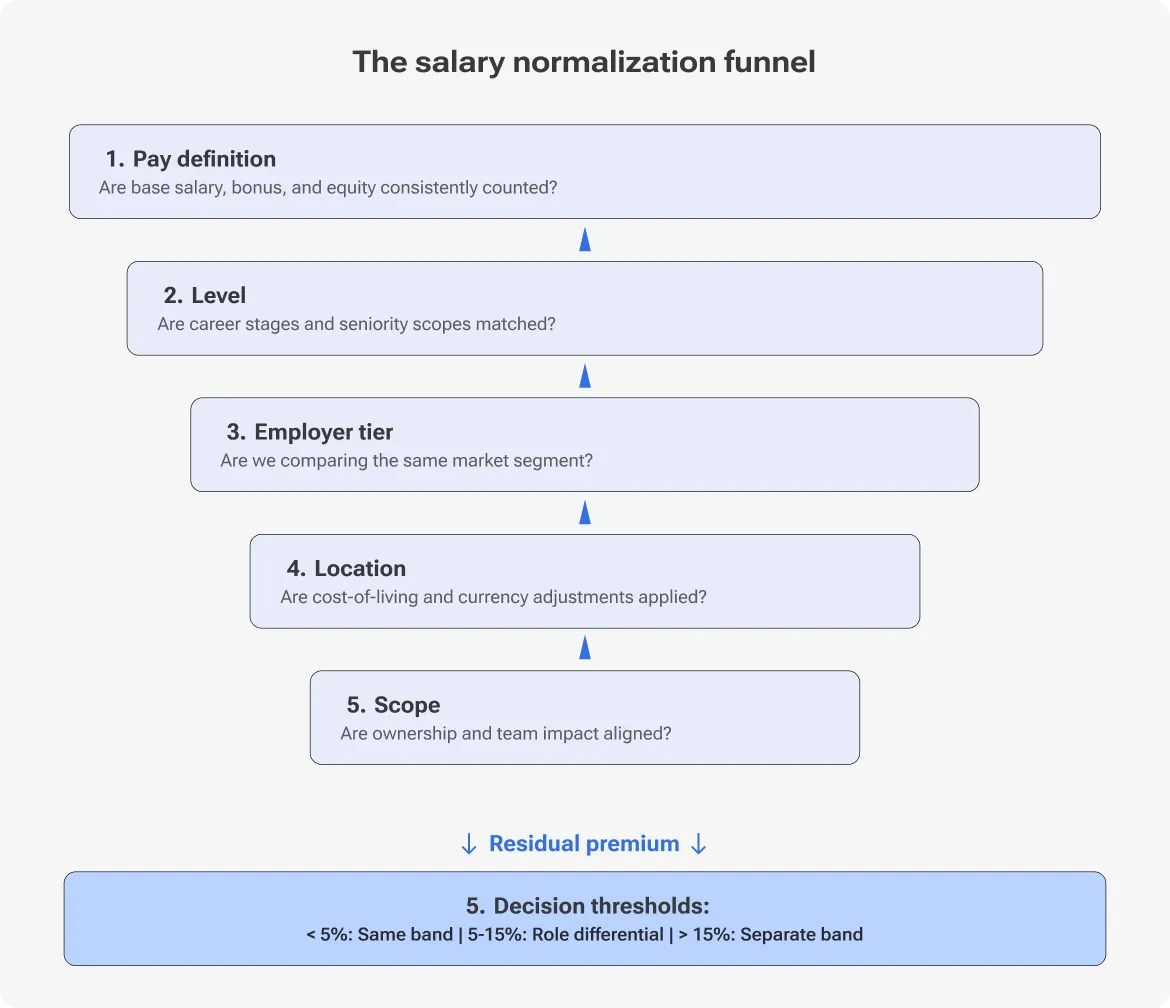
A reported salary premium should be treated as a hypothesis until it survives five controls.
1. Pay definition
Is the figure base salary or total compensation?
Compare base with base first. If equity and bonuses materially affect the role, show total compensation separately. OEWS is useful for wages; Levels.fyi is better suited to equity-inclusive compensation. This control removes differences created by stock and bonus mix.
2. Level
Are both roles being compared at equivalent career stages?
Use standardized Levels.fyi levels where they are available or map the positions to your internal ladder. Otherwise, a category with more staff engineers will appear to carry a role premium even when equal-level pay is similar.
3. Employer tier
Do both samples represent comparable companies?
AI laboratories, large technology companies, funded startups, enterprise employers, and non-technology businesses recruit from different compensation markets. Company-level salary pages can reveal when a national title median is being driven by one employer segment.
4. Location
Are the figures national or metro-specific? Do they reflect office-based or remote employees?
Self-reported datasets may overrepresent expensive technology hubs. Comparing a Bay Area-heavy sample with a national benchmark can produce an apparent role premium that is mostly geographic.
5. Scope
Do the jobs carry the same production ownership, on-call requirements, decision authority, or leadership responsibility?
Titles are not reliable substitutes for job content. Your career framework should establish whether a role genuinely has broader scope.
The remaining difference after these controls is the residual premium.
The following thresholds are editorial policy rather than market data:
Below 5%: Keep the role on the common software engineering band.
Between 5% and 15%, persistent across two independent sources: Add a role differential while retaining the same ladder.
Above 15%, supported by genuinely different scope: Consider a separate compensation band.
Worked example: ML engineer vs software engineer salary
The headline comparison is dramatic. Levels.fyi's US ML engineer figure of $305,000 is 56% higher than its $195,000 median for US software engineers.
Most of that difference weakens under scrutiny.
Pay definition: Stack Overflow uses the same self-reported salary-and-bonus definition for all roles. In its US data, AI/ML engineers earn 8% more than back-end developers but 37% more than full-stack developers. Changing the comparator moves the premium by 29 percentage points. Back-end is the closer scope match.
Level: Levels.fyi's matched data puts the AI premium at 6.2% for entry-level engineers and 18.7% at staff. The 56% headline figure therefore contains a substantial seniority-mix effect.
Employer tier: At Intuit, Levels.fyi reports roughly $917,000 for staff AI engineers and $515,000 for non-AI peers, a 78% gap within one employer. That is useful company-level evidence, but it is also an outlier rather than a national compensation rule. Dice's finding that AI professionals skew senior reinforces the need to benchmark within the relevant employer tier.
Location: Levels.fyi's Bay Area software engineer median is $278,000, 44% above its US figure of $192,500. An ML sample concentrated in that region could create much of the apparent national premium. The geographic distribution of the ML data points needs to be checked.
Scope: Dropbox uses the same individual-contributor level scheme for ML engineers and general software engineers. If the two jobs carry equivalent scope in your organization, there is no separate scope premium to add.
After these controls, the defensible ML premium is closer to 6–19%, depending on level, in Levels.fyi data and approximately 8% against back-end developers in Stack Overflow. Two independent sources support a real but moderate differential.
That evidence favors one engineering ladder with a level-sensitive premium: minimal at entry level and largest at staff. A separate band makes more sense for research-oriented positions with substantially different responsibilities. BLS computer and information research scientists, for reference, earn a $140,300 median.
The same process cannot validate Stack Overflow's 21% back-end premium over front-end. There is no public level-matched source to complete the second control. Until internal offer data supports it, the safer choice is a common band.
From salary to total employment cost
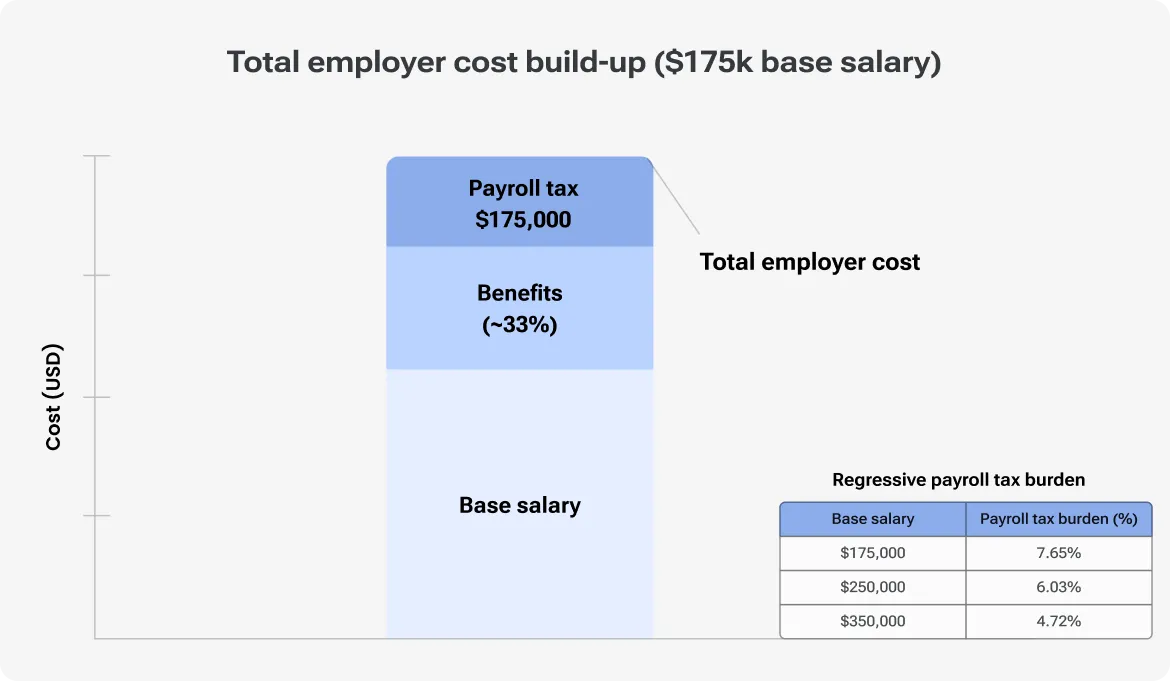
Base salary is only the starting point when calculating the cost to employ a software engineer.
Benefits
Benefits represented 30.0% of private-industry employer compensation costs in June 2026, according to the BLS ECEC. Engineering-related occupations and industries tend to carry a higher load:
Benefits account for 31.5% of compensation in management, professional, and related occupations. That works out to roughly 46 cents in benefits for every dollar of wages, based on Table 4.
In the information industry, the share is 35.4%, or about 55 cents per wage dollar.
In March 2026, benefits represented 32.7% of compensation at the 90th wage percentile, compared with 30.6% at the median, according to the BLS ECEC.
ECEC classifies supplemental pay, including non-production bonuses, as a benefit. Equity-heavy roles still require a separate line for the expected value of stock grants.
Payroll taxes
Employer Social Security tax is 6.2% up to the 2026 wage base of $184,500. Medicare adds 1.45% without a cap, as summarized by Paycor.
Because Social Security contributions stop at the wage ceiling, the effective employer payroll-tax rate falls as salary increases:
The company still pays more tax in absolute dollars for the higher salary, but tax represents a smaller percentage of compensation.
Role-specific costs
Sign-on bonuses tend to appear in roles and markets where employers compete aggressively for scarce candidates. Levels.fyi reports a $35,000 median sign-on bonus for Salesforce engineering managers. This type of cost should be estimated from company- and role-specific data rather than applied as a flat percentage.
Broad wage growth provides context rather than a technology benchmark. Private-industry wages and salaries rose 3.1% in the year to June 2026, while inflation-adjusted wages fell 0.4%, according to the ECI.
What is changing engineering pay in 2026
AI and ML are becoming established engineering tracks rather than occasional specialist titles. Levels.fyi describes AI/ML as one of the largest and highest-paid software engineering tracks in its 2025 data, but the premium is concentrated among senior and staff engineers.
Entry-level compensation is moving differently. The Levels.fyi entry-level median grew 1.64% in 2025, compared with 7.52% at staff. Dice, using a different dataset, found that entry-level technology pay declined for a second year.
Across all software engineering levels, Levels.fyi's US median total compensation increased 3.49%. That is close to the ECI's 3.1% growth figure for private-industry wages, although the two sources measure different populations and types of pay.
Levels.fyi also recorded a 12% increase in office-based roles among its submissions. That indicates a change in work arrangements, not a 12% increase in salary.
Job advertisements are becoming more useful as a secondary benchmark. California, Colorado, Illinois, Massachusetts, New Jersey, New York, Washington, and several other states require employers to publish salary ranges under various conditions, as shown in this 2026 tracker. The ranges can still be broad, and advertised pay is not the same as accepted pay, but postings provide an additional view of current offers.
The sources also refresh on different schedules. BLS released its May 2025 OEWS estimates in May 2026; the May 2026 edition is expected in spring 2027. Stack Overflow publishes annually, while Levels.fyi title pages update continuously.
For compensation decisions, the practical rule is straightforward: compare roles within the same source, match level before title, and add a premium only when it survives controls for pay definition, employer, location, and scope.
Great software starts with great people.
FAQ
Which software developer role pays the most in the US in 2026?
In Stack Overflow's 2025 US data, engineering managers have the highest median at $200,000. AI/ML engineers follow at $189,500, narrowly ahead of cloud infrastructure engineers at $189,000.
These title medians do not represent the upper end of the market. Levels.fyi reports $457,500 in median total compensation for staff software engineers, which exceeds most role-level figures.
How much does an entry-level software developer earn in the US?
Levels.fyi reports median total compensation of $155,000 for entry-level engineers at the technology employers represented in its 2025 data.
BLS shows the bottom 10% of software developers earning less than $82,460 across the broader US economy, but that percentile is not an entry-level benchmark. Dice reported a 1.4% decline in entry-level technology pay in 2024.
Do remote software developers earn less than office-based developers?
The sources used here do not provide a level-matched comparison of remote and office-based software engineers.
Location produces a clearer difference. Levels.fyi's Bay Area software engineer median is 44% higher than its US figure. The company also recorded 12% growth in office-based roles among 2025 submissions, but that change does not establish a salary premium for office work.
How much have software developer salaries grown since 2024?
Levels.fyi reports 3.49% growth in median US software engineering total compensation during 2025. Growth varied substantially by level, from 1.64% at entry level to 7.52% for staff engineers.
Private-industry wages increased 3.1% in the year to June 2026. Larger year-over-year changes for individual roles in Stack Overflow should be interpreted cautiously because changes in the respondent mix may account for part of the movement.
Does knowing a particular programming language raise pay more than changing roles?
The available evidence does not support a broad language premium. Primary sources show differences of tens of thousands of dollars across roles and levels, while many public estimates for programming-language premiums come from individual recruiter reports that do not control for seniority.
Treat a language premium as unverified unless it appears in level-matched data for comparable employers.
Are salary ranges in US job postings reliable for benchmarking a role?
They are useful as a cross-check, not as a standalone benchmark.
Job advertisements show intended offers rather than accepted compensation, and one range may cover several levels. In states requiring good-faith ranges, postings can help test whether BLS or Levels.fyi figures resemble the current hiring market. They should still be compared with actual offer, payroll, and employee compensation data.