How much does a software developer earn in the United States? One credible answer is $135,980 a year. Another is $192,500.
The first figure is the median wage reported by the U.S. Bureau of Labor Statistics for May 2025. The second is Levels.fyi's median total compensation for US software engineers in 2025. The gap is 42%, yet neither figure is necessarily wrong. They measure different things.
Most comparisons of software developer salaries by country mix base wages with total compensation, employee salaries with contractor invoices, and advertised ranges with actual earnings. Currency conversion introduces another variable. A ranking can change simply because the exchange rate moved, even when local salaries did not.
The benchmarks below include the source, reference period, and pay definition behind each figure. The article then introduces the Like-for-Like Salary Stack: five filters for deciding whether two salary figures can reasonably be compared.
The scope is limited to salaries. It does not cover hourly rates, outsourcing fees, or agency pricing.
Motivated and focused experts for up to 60% less than locals, delivered in days, not months.
Software developer salaries by country in 2026: a practical snapshot
A strict ranking from first to twentieth would suggest more precision than the data supports. Two credible sources for the same country may disagree by more than the difference between neighbouring countries.
Grouping markets into broad pay bands gives a more honest picture. Local currency is shown first. Unless a source already publishes figures in dollars, USD conversions use European Central Bank reference rates from 8 September 2026. Figures are medians for blended developer populations unless identified as means.
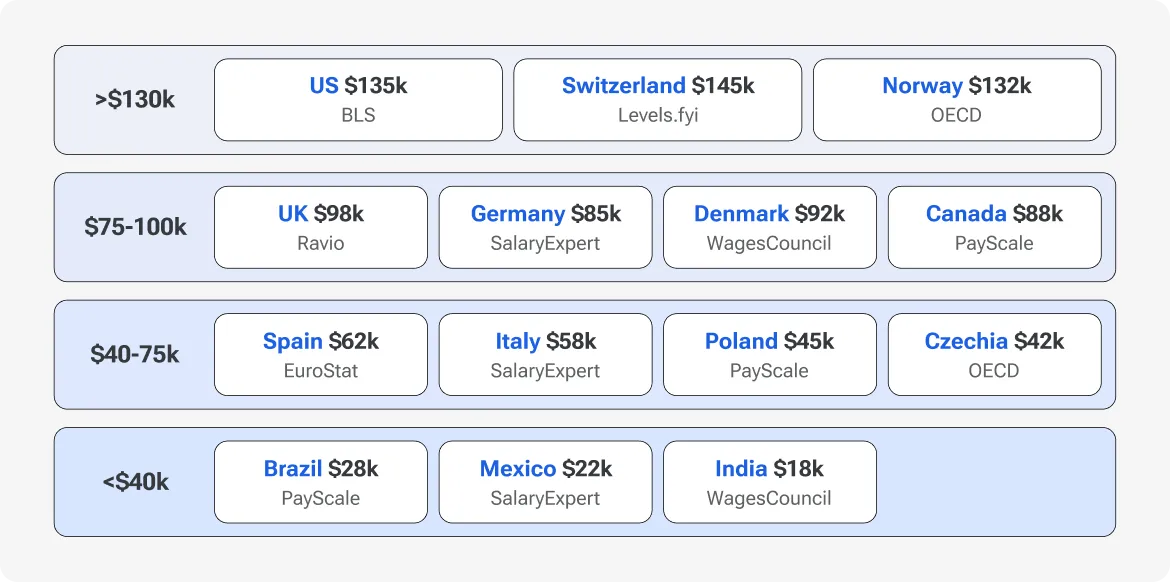
Band 1: above roughly $130,000 in base pay or $145,000 in total compensation
United States: $135,980 median wage in May 2025, according to the BLS. This is primarily a cash-wage benchmark and excludes equity. The bottom 10% earned less than $82,460, while the top 10% earned more than $214,670. Metro area and employer tier make a substantial difference.
Switzerland: $148,289 in median total compensation, the highest European country figure in Levels.fyi's 2025 report. The result reflects both the concentration of multinational employers and the strength of the Swiss franc.
Band 2: roughly $75,000–$100,000 in base pay
United Kingdom: £70,000 ($94,800) for a mid-level P3 engineer in Ravio's October 2025 payroll data. Statistics covering all UK employers are lower.
Germany: €74,100 ($86,100) for a P3 engineer in the same Ravio dataset.
Netherlands: €73,200 ($85,000), using the same level and methodology.
Sweden: €68,600 ($79,700), Ravio P3.
France: €65,600 ($76,200), Ravio P3.
Canada: approximately CAD 117,500 ($85,100), calculated by annualizing the national median hourly wage for NOC 21231 over 2,080 hours. The Job Bank figure was updated in November 2025.
Australia: AUD 2,537 a week, equivalent to AUD 131,924 ($95,200) a year. This is the May 2025 full-time median for ANZSCO 2613 published by Jobs and Skills Australia. Employer-funded superannuation is paid on top.
Israel: more than NIS 36,000 a month across the high-tech sector in June 2026, or roughly NIS 432,000 ($143,400) a year, according to CBS data reported by i24NEWS. This is a sector-wide mean rather than a developer median, so it is better treated as an upper-bound indicator than a direct country benchmark.
Band 3: roughly $40,000–$75,000
Spain: €55,900 ($64,900) for a P3 engineer in Ravio payroll data.
Poland: PLN 21,573 a month gross, equivalent to about $69,600 a year, for senior employment-contract vacancies advertised in 2025 by Just Join IT. B2B figures cannot be compared directly without converting the contractor invoice into an employee-equivalent amount.
Ukraine: around $4,500 a month after tax for senior developers in June 2026, based on DOU data reported by LIGA.net. Because DOU reports net income, the equivalent employee gross salary would be higher.
Band 4: below roughly $40,000
Ireland, Denmark, Norway, Romania, Czechia, Brazil, Mexico, Argentina, and African markets are excluded from the snapshot because this edition did not find a sufficiently comparable, methodology-backed developer benchmark for them.
Why software engineer salary rankings disagree
Most large discrepancies come from the type of source being used, not from a calculation error. Six kinds of salary data appear repeatedly in country rankings.
Government wage surveys
Sources such as BLS OEWS, ONS ASHE, the Canadian Job Bank, and the Australian Bureau of Statistics draw from large employer or payroll samples. Their main limitation is time: published figures may lag the market by 12–18 months.
BLS estimates, for instance, combine six semiannual survey panels collected over three years. OEWS excludes self-employed workers and does not capture stock awards.
These datasets are best used as broad all-employer benchmarks.
Self-reported total compensation platforms
Levels.fyi and TechPays usually include base salary, bonuses, and annualized equity. Contributors are concentrated in the technology sector and are not representative of every employer. Amazon is the largest employer represented in both Levels.fyi's US and Canadian samples.
These platforms are more useful for benchmarking global technology companies and other top-paying employers.
Developer surveys
Stack Overflow asks respondents to report total annual compensation before tax. For its 2025 survey, amounts were converted into US dollars using the exchange rate from 25 June 2025.
The survey received 49,009 responses, but only 23,928 people answered the compensation question, according to its published methodology. Its value lies in comparing countries or roles within the same dataset, not in treating each median as a definitive national salary.
Job-ad data
Just Join IT, No Fluff Jobs, and ITJobsWatch measure advertised compensation. An advertised range is not the same as the amount employees actually receive.
Just Join IT's survey found that real mid-level earnings were 19–21% below the medians shown in job ads. Vacancy data can indicate where offers are moving, but it should not be mistaken for payroll data.
HR payroll benchmarks
Platforms such as Ravio and Pave pull compensation information from HR systems. That gives them access to real payroll records, although their client base may be concentrated among startups and venture-backed companies.
Ravio's reporting by funding stage makes that bias visible. These platforms are useful for benchmarking the middle and upper segments of the technology market.
Modeled estimates
Glassdoor, ZipRecruiter, Payscale, and SalaryExpert frequently appear in salary rankings, but their modeled figures are difficult to reproduce because the underlying methodology and weighting are not always transparent.
They may provide a rough reference point. They are a weak basis for compensation decisions.
For the comparisons in this article, figures from different source types are not averaged together.
United States: three different versions of the same salary
The most commonly quoted US figures describe separate parts of the market.
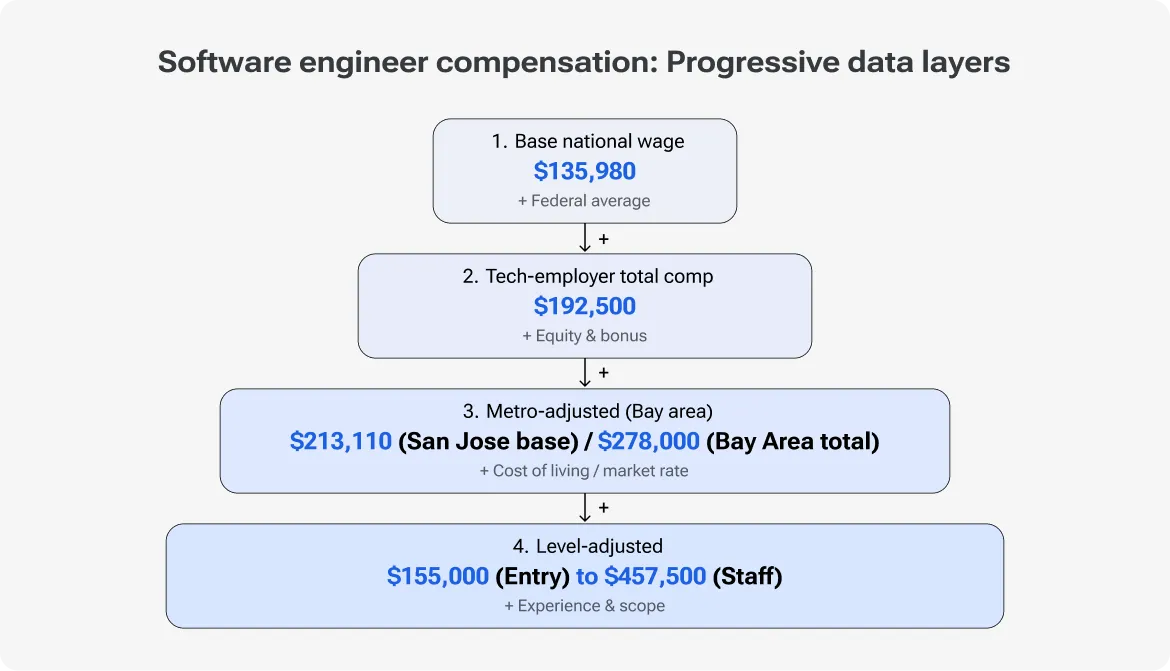
National base wage. The BLS median of $135,980 covers an occupation with approximately 1.7 million jobs. Its range is wide: from less than $82,460 at the 10th percentile to more than $214,670 at the 90th. That spread is larger than the difference between the US median and most countries in the second salary band.
Technology-employer total compensation. Levels.fyi reports a US median of $192,500, 42% above the BLS figure. Equity, bonuses, and employer mix account for much of the difference.
The gap grows by level. Levels.fyi's 2025 medians ranged from $155,000 for entry-level engineers to $312,587 for senior engineers and $457,500 for staff engineers.
Metro pay. In May 2025 OEWS data, San Jose's median wage reached $213,110, 57% above the national median. San Francisco followed at $186,640, Seattle at $167,280, and New York at $166,830.
The total-compensation figures were higher again. Levels.fyi placed the Bay Area median at $278,000 and Seattle at $250,000.
Movement during 2025 was comparatively modest. Median US total compensation grew by 3.49% across software engineering levels. Meanwhile, the share of office-based roles in Levels.fyi submissions increased by 12% year over year.
For current offers, published salary ranges provide a useful third reference point. California, Colorado, New York, Washington, and several other states require employers to disclose compensation ranges in job postings.
UK and Western Europe: slow growth, large internal differences
Software developer salaries across much of Europe barely moved in 2025. Ravio recorded growth of 1.0–1.9% for mid-level P3 engineers in the UK, Germany, the Netherlands, France, and Spain. Sweden was the exception at 5.5%.
The slowdown was especially clear in the UK, where benchmark growth fell from 8.5% in 2023–2024 to 1.6%.
Ravio's payroll medians tend to exceed national statistics because it serves a different employer population.
In the UK, Ravio's £70,000 P3 benchmark is 23% above the provisional 2025 ASHE median of £56,914 for full-time programmers and software development professionals. ASHE draws from PAYE records across the wider economy, not just technology-focused employers.
Germany shows a similar split. The WSI Lohnspiegel survey reports monthly full-time pay of €5,260 after ten years of experience, or approximately €63,100 annually. Ravio's P3 benchmark is €74,100. The WSI research also found that employers covered by collective bargaining agreements paid around 13% more.
Switzerland sits apart from most of the region. Its $148,289 median total compensation in Levels.fyi data is roughly double the Europe-wide median of $73,618.
Annual figures also depend on what the country considers part of salary:
Dutch employees are entitled to a holiday allowance equal to 8% of gross pay. Some benchmarks include it; others report it separately.
Employers in Spain, Portugal, and Austria commonly divide annual salaries into 14 payments. Multiplying one monthly payment by 12 can therefore understate annual income by about 14%.
Ireland, Denmark, and Norway have multinational hubs that push top-tier compensation upward, but this edition did not identify comparable national developer medians for those markets.
Poland, Ukraine, and Romania: the contract matters as much as the salary
A senior developer in Poland or Ukraine may work as an employee, invoice through a sole proprietorship, or use another contractor arrangement. The headline amount may therefore represent employee gross salary, after-tax income, or a business invoice.
Poland
Just Join IT reports employment-contract compensation as gross salary. B2B compensation is shown as the contractor's net invoice value before VAT.
In 2025 job ads, the median for senior developers was PLN 21,573 a month under an employment contract and PLN 24,780 under B2B. The B2B premium was 14.9% for seniors and 26% for mid-level developers.
Advertised compensation was not always what people earned. In the same report, a survey of 4,400 IT specialists found that senior employees received a median of PLN 18,050 a month, 18% below the employment-contract figure advertised in vacancies. Senior B2B contractors, by contrast, earned slightly more than the advertised median.
A B2B invoice should be adjusted for the expenses and risks transferred to the contractor, including social contributions, unpaid leave, and unpaid sick days. A practical shortcut is to use the employment-contract median for the same level from the same dataset. It reflects the market's own valuation of the difference.
Since 24 December 2025, Polish employers have been required to disclose starting compensation or a salary range to candidates. They may no longer ask applicants about previous pay, according to Lockton's summary of the requirements. That makes employment-contract vacancies more useful as a current market reference.
Ukraine
DOU's May-June 2026 survey reports a developer median of $3,500 a month after tax. Senior developers earned $4,800 at product companies and $4,650 at outstaffing companies.
These are net dollar figures. For FOP sole proprietors using Ukraine's simplified taxation system, the gap between gross revenue and take-home income is narrower than it would be for a conventional employee.
Wartime relocation adds volatility, particularly in smaller location and specialization groups.
Romania
Romania ended its income tax exemption for software developers beginning with January 2025 income, as covered in PwC Tax Summaries. The same gross salary therefore produces lower take-home pay than it did in 2024.
Any comparison across that policy change should use gross compensation. Comparing net salaries would make a tax change look like a market pay cut.
Canada, Australia, Israel, India, and Latin America
Canada
The Canadian Job Bank reports a national median wage for software engineers and designers that annualizes to approximately CAD 117,500, or $85,100, over 2,080 working hours.
Levels.fyi's Canadian median total compensation was $96,145 in 2025, down 2.03%. Vancouver led its city data at $120,667, followed by Toronto at $103,455.
Depending on the source, the software engineer salary gap between the US and Canada looks very different. National wage statistics put the US approximately 60% higher. Technology-employer total compensation puts the difference closer to 100%.
Australia
The full-time median for software and applications programmers was AUD 2,537 a week, according to data published by Jobs and Skills Australia.
Australian employers also pay the superannuation guarantee. The rate increased to 12% of ordinary time earnings on 1 July 2025. A compensation "package" that includes superannuation can therefore appear around 12% higher than the salary for the same position.
Jobs and Skills Australia has frozen its older ANZSCO occupation pages as it moves toward the OSCA classification. Anyone using Australian benchmarks should check which occupational system the source follows.
Israel
Israel's Central Bureau of Statistics reported an economy-wide average wage of NIS 15,218 a month in June 2026. The high-tech sector average exceeded NIS 36,000.
That is a sector premium of more than two times. Both numbers are means rather than medians, and their position in USD rankings changes with the shekel exchange rate.
India
India has one of the widest gaps between local employers and multinational technology companies.
Levels.fyi collected 20,400 Indian submissions in 2025 and reported median total compensation of $33,768. Bengaluru led its city data at $40,359. Stack Overflow's median for Indian back-end developers was $22,086.
Differences in experience also affect the national result. Students made up 17.8% of Indian Stack Overflow respondents, compared with 5.6% in the US.
Indian offers are often expressed as CTC, or cost to company. CTC may include employer contributions and variable compensation, so the employee's fixed cash salary and in-hand income can be materially lower.
Latin America
Brazilian compensation depends heavily on contract form. CLT employees receive a 13th salary, a vacation bonus equal to one-third of monthly pay, and employer FGTS deposits. PJ contractors invoice without those protections. CLT and PJ amounts require the same kind of normalization as Polish employment and B2B figures.
Mexican employees receive a mandatory year-end aguinaldo bonus. The market also includes developers working remotely for US companies, whose compensation may sit well above local salary bands.
Argentina is omitted because inflation and exchange-rate conditions make annual USD comparisons unstable. No African country met the methodology threshold for this edition.
A country median may describe the wrong employer market
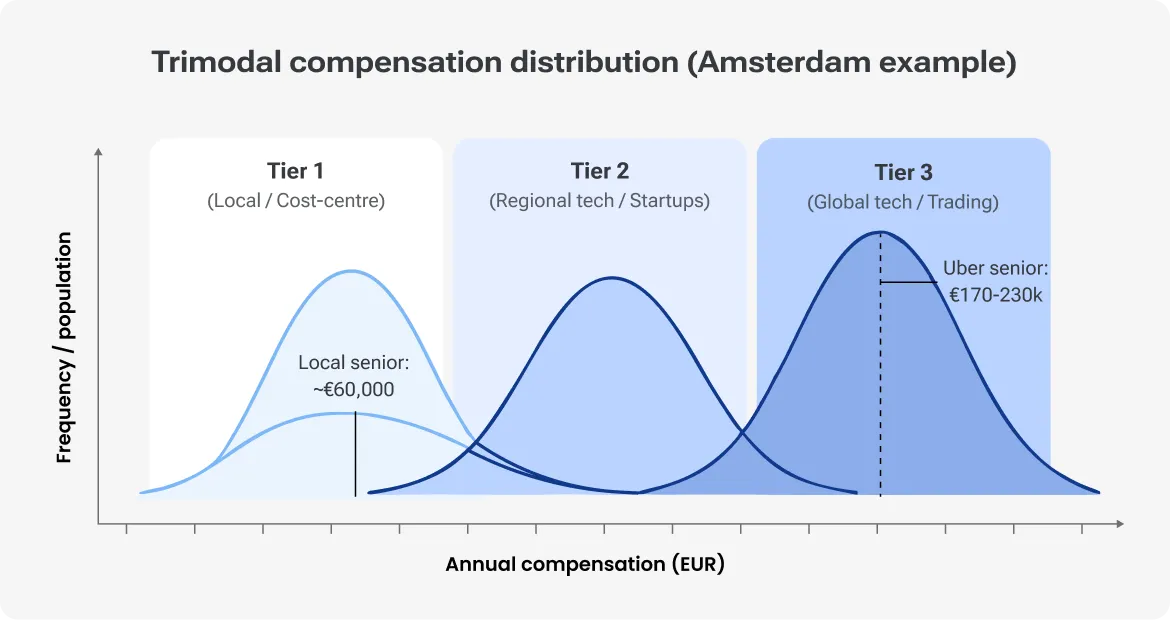
Gergely Orosz, then an engineering manager at Uber in Amsterdam, described software engineering compensation as trimodal. Rather than forming one continuous national market, salaries often fall into three partly separate distributions:
Tier 1: Local companies that treat engineering primarily as a cost centre and benchmark against nearby employers.
Tier 2: Regional technology companies and funded startups competing within a broader technology market.
Tier 3: Global technology companies and trading firms benchmarking internationally and offering substantial equity.
The distributions may barely overlap. Orosz reported that senior total compensation at Uber Amsterdam reached €170,000–€230,000 by 2020. A 2021 local salary report placed Amsterdam's most experienced engineers at approximately €60,000. In a 2025 follow-up, he described Uber's senior compensation as two to five times that of many local senior roles.
Current data still shows the pattern. Optiver's Amsterdam office appears among Levels.fyi's seven highest-paying employers for entry-level engineers, with compensation of $256,896. Levels.fyi's all-level Dutch median of €86,816 is also 19% above Ravio's €73,200 mid-level benchmark.
A national median can rise when top-paying international employers open local offices, even if traditional local companies do not change their salaries. The useful benchmark is therefore the employer tier from which a company expects to recruit.
For the top tier, Levels.fyi and TechPays are the more relevant sources. Ravio and Pave better represent the middle technology tier. National statistics, local surveys, and job boards give a clearer view of the broader local market.
Gross salary, take-home pay, and employer cost are different benchmarks
One position generates at least three compensation figures:
-
Gross employee salary.
-
Employee take-home income.
-
Total employer cost.
Rankings based on software engineer salaries after tax will not follow the same order as gross-salary rankings.
The OECD's Taxing Wages 2026 report puts the average tax wedge at 35.1% for a single worker earning the average wage in 2025. The tax wedge includes income tax and both employee and employer social contributions as a share of total labour cost.
Its composition differs substantially by country. Income tax and employee contributions consume 39.5% of gross pay in Belgium and 38.7% in Germany, compared with 18.1% in Switzerland and 21.4% in Israel. In France, employer social security contributions alone add roughly one-third on top of salary. The UK recorded the largest increase in its tax wedge during 2025, at 2.45 percentage points, partly because of higher employer contributions.
These OECD figures model average earners. Software developers often earn well above the national average. At higher income levels, contribution caps and progressive income tax can change the effective burden.
Cost-of-living adjustments have their own limitation. Purchasing power parity reflects average national consumption. It does not adequately capture housing costs in technology centres such as London, Zurich, or San Jose. A PPP-adjusted salary can therefore overstate the spending power of someone living in an expensive technology hub.
For a real offer, the defensible approach is to enter one fixed gross amount into each country's official payroll calculator using the same date and household assumptions.
Does AI lower the cost of hiring engineers?
Compensation components should also remain separate:
13th- and 14th-month payments and Dutch holiday allowance may be part of salary.
Australian superannuation and employer pension contributions belong to employer cost.
Equity belongs to total compensation, not base salary.
Meal vouchers and similar payments should be classified as benefits.
None of these figures represents the price of hiring through an agency or outsourcing vendor.
Country pay gaps widen with seniority
Cross-country differences depend on both role and level. Stack Overflow's 2025 data shows the variation within one consistent survey:
Engineering managers earned a median of $200,000 in the US, compared with $118,335 in Germany and $52,308 in India. The US figure was 69% above Germany's.
Cloud infrastructure engineers earned $189,000 in the US and $98,612 in Germany, a difference of 92%.
Back-end developers earned $175,000 in the US, $87,011 in Germany, and $22,086 in India. The US median was approximately twice the German figure and 7.9 times the Indian figure.
The experience profile of each survey sample can distort the comparison before specialization is considered. With nearly one in five Indian respondents identifying as students, country medians should be compared within professional-experience bands whenever the data allows it.
Levels.fyi's US data also shows faster growth at higher levels. Staff-engineer compensation increased by 7.52% in 2025, and engineering-manager compensation by 9.64%. Entry-level pay rose by only 1.64%.
Ravio reported a 73% decline in hiring rates for P1 and P2 engineering positions across European technology companies. It associated the decline with AI tools absorbing some routine junior work.
Will AI replace junior developers?
Measured AI compensation premiums are smaller than many headlines imply. Ravio found an average AI/ML premium of 12% for individual contributors and 3% for managers. In Stack Overflow's US data, AI/ML engineers earned $189,500, 8% more than back-end developers. Levels.fyi identifies AI/ML as one of the largest and highest-paying software engineering tracks but does not publish one universal premium.
Level names can also mislead. Ravio's often-quoted £110,200 UK "senior software engineer" figure refers to its M3 Senior Manager level. It is a management-track benchmark, not compensation for a senior individual contributor.
The Like-for-Like Salary Stack
Before using a country figure in a compensation decision, test it against five questions. Each filter can be scored as 0 when the information is unknown, 1 when it is stated, and 2 when the figures have been normalized.
1. Pay definition
Does the number represent base salary, cash compensation, or total compensation?
Base salary is usually the cleanest starting point for international comparisons. Total compensation should appear separately where equity or bonuses are material.
2. Contract form
Is the figure employee gross salary or a contractor invoice, such as Polish B2B, Ukrainian FOP, or Brazilian PJ income?
Convert contractor compensation into employee-equivalent gross pay or exclude it from the comparison.
3. Currency and reference period
Show local currency first and convert every figure using one exchange-rate date.
A 2024 salary survey and 2026 job-ad data should not appear in the same comparison row as if they describe the same market period.
4. Level and employer tier
Map each role to a consistent leveling framework and employer tier.
A senior engineer at a local company should not be compared directly with a senior engineer receiving equity from a global technology firm.
5. Take-home income and purchasing power
Net pay and PPP can add context, but they should be separate columns. Neither should replace gross compensation as the primary comparison.
The five filters produce a maximum Comparability Score of 10. A figure scoring below 6 should be used only as context. This is an editorial rule rather than a statistical threshold.
Worked example: a Polish B2B senior and a German senior employee
Consider two raw inputs:
PLN 24,780 a month for a Polish senior developer working under B2B, based on Just Join IT's 2025 advertised median.
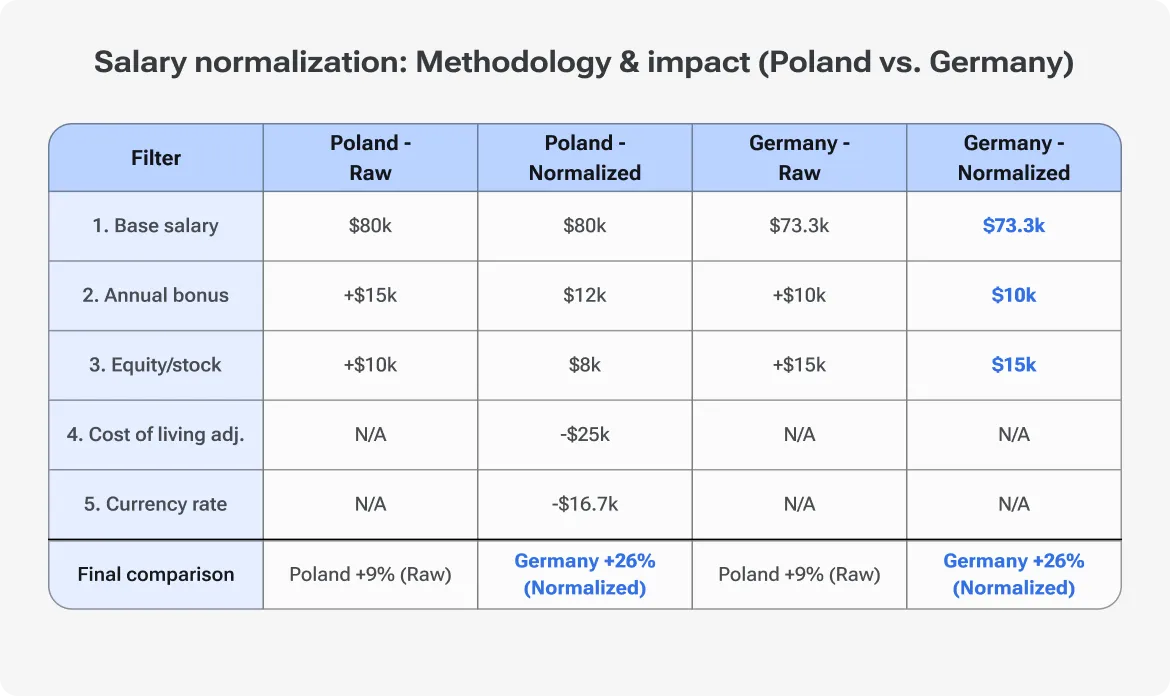
Annualized using ECB reference rates from 8 September 2026, the figures are approximately $80,000 for Poland and $73,300 for Germany. A direct comparison suggests that Poland pays 9% more. The Polish number initially scores only 4 and is not suitable for a compensation decision.
Pay definition: Both figures describe monthly cash income, although neither makes the treatment of special payments entirely clear. Each scores 1.
Contract form: The Polish figure is a net B2B invoice. Replacing it with the same report's senior employment-contract median of PLN 21,573 converts it into an employee-gross benchmark. Poland moves to 2. Germany is already employee gross and also scores 2.
Currency and period: Both datasets are from 2025 and use the same conversion date. Each scores 2.
Level and source population: The Polish figure is advertised pay, while the German figure reflects reported earnings. Just Join IT's survey found that senior employees actually earned PLN 18,050, so that becomes the better Polish input. The levels remain approximate because a senior vacancy label is being compared with ten years of experience. Each scores 1.
Take-home and purchasing power: Neither has been calculated. Each scores 0.
After normalization, the Polish benchmark becomes PLN 216,600 a year, or approximately $58,300. Germany remains at $73,300. The apparent Polish advantage of 9% becomes a German advantage of 26%.
Both figures now score 6. That is sufficient for a broad salary-band decision, but not for pricing an individual offer.
For distributed teams, compensation bands should be built by employer tier as well as country. Equity belongs in a separate column. National statistics can be refreshed annually, DOU data twice a year, and payroll-platform figures whenever their underlying datasets update.
What is changing software developer salary data in 2026
Pay transparency is arriving unevenly across Europe. EU member states were required to transpose the Pay Transparency Directive by 7 June 2026. Its provisions include giving candidates pay information before an interview and prohibiting questions about salary history.
According to Morgan Lewis, only Italy, Slovakia, Lithuania, and Malta had implementing laws in force at the deadline. The Netherlands, Sweden, Czechia, and Denmark set 1 January 2027 as their implementation date. Greece completed transposition in July 2026. European job-ad data will become more useful at different times in different countries.
Survey samples are getting thinner. Stack Overflow received 48,019 compensation responses in 2024 but only 23,928 in 2025. Country-level sample sizes should be shown wherever possible: the 2025 German median was based on 2,141 responses, while India's relied on 1,093.
Exchange rates continue to move rankings. Poland's senior employment-contract ad median of PLN 258,876 a year was worth $72,100 at ECB rates on 31 December 2025. At the 8 September 2026 rate, the same local salary was worth $69,600. That appears as a 3.4% decline in a dollar-denominated ranking, despite no change in Polish pay.
Location-based compensation is being redesigned rather than discarded. GitLab retired its San Francisco-anchored compensation calculator on 30 May 2025 and began moving toward market-aligned ranges expressed in local currencies.
Salary growth has slowed. Ravio's 1–2% growth across several European markets and Levels.fyi's 3.49% US increase do not support broad claims that software engineering salaries are surging everywhere.
A defensible salary band begins with the employer market a company competes in. It then uses one source type per tier, applies the five normalization filters, and rejects any figure that lacks a source, reference period, or pay definition.
Great software starts with great people.
FAQ
What is the global median software developer salary in 2026?
There is no defensible universal median because every dataset gives countries different weights.
Stack Overflow's 2025 global medians were $79,742 for back-end developers and $72,509 for full-stack developers. These are self-reported total-compensation figures shaped heavily by the survey's largest respondent countries: the US, Germany, India, the UK, and France.
Which country pays software engineers the most after tax?
The US and Switzerland lead on gross compensation. Switzerland becomes more competitive after tax: the OECD puts income tax and employee contributions at 18.1% of average-wage gross pay there, compared with 38.7% in Germany.
The exact result depends on income, household type, canton or state, and local taxes.
Do remote-first companies pay the same salary in every country?
Most do not. Common approaches include anchoring salaries to one city and applying location factors or setting separate market ranges for each country.
GitLab, long cited for its public remote-pay methodology, retired its location-factor calculator in 2025 and is moving toward local-currency market ranges.
How much more do software engineers earn in the US than in Canada?
National wage statistics put the difference at approximately 60%: $135,980 in the US versus roughly $85,100 in Canada.
Levels.fyi's technology-employer data produces a gap closer to 100%, with median total compensation of $192,500 in the US and $96,145 in Canada. Currency movements can change both comparisons.
How often should distributed teams refresh salary benchmarks?
At least once a year, ideally when the relevant national statistics are released.
Semiannual sources such as DOU and current job advertisements can support a mid-year review. Payroll platforms update more frequently. Currency conversions should be recalculated during every refresh, even if local salaries have not moved.
Which cities outside the US pay software developers the most?
Among the non-US cities included in Levels.fyi's 2025 report, Vancouver led with median total compensation of $120,667, followed by Toronto at $103,455. Bengaluru was India's highest-paying city at $40,359.
Switzerland ranked above other European markets at $148,289, although Levels.fyi reported that figure at the country rather than city level.