Most companies begin their digital transformation with a clear vision of what they want to build. Very few begin with a clear picture of how they will know if it is working.
That gap is expensive. According to BCG, 84% of digital transformation initiatives fail to meet their objectives, and inadequate progress monitoring is one of the most consistent factors. Companies invest in new platforms, retrain teams, and migrate infrastructure, then try to measure success with the same financial reporting tools they used before the transformation started. The data tells them very little. The decisions that follow are worse.
The problem is rarely a lack of data. It is the absence of a deliberate measurement framework, one built before the transformation begins, tied to specific business outcomes, and structured to evolve as the program matures. A Deloitte study of 1,600 executives found that organizations using a holistic set of KPIs across financial, customer, operational, and workforce dimensions report on average 20% more value from their digital initiatives than those that do not.
Getting measurement right is not a post-launch consideration. It is a prerequisite.
This guide covers the KPIs that matter across every dimension of digital transformation, how to select the right ones for your context, and the mistakes that consistently undermine well-funded programs.
Seamless digital transformation with 30% faster time to market and budget savings of up to 20%
How to choose the right KPIs for your digital transformation
Not every KPI on this list belongs in your measurement framework. Tracking too many metrics creates noise; tracking the wrong ones creates false confidence. Before selecting your KPIs, answer these four questions.
Question 1: What is your primary business goal for this transformation?
Your KPIs should trace directly back to a business outcome — not a technology milestone. Deploying a new ERP system is not a goal. Reducing order processing time by 40% is.
Use this to filter:
Business goal
KPI categories to prioritize
Economic KPIs, market share metrics
Operational efficiency, process automation rates
Improve customer retention
Customer-centric metrics, NPS, CES
Technology adoption, infrastructure scalability
Build internal capability
Employee metrics, digital skills proficiency
If your goal does not clearly map to one of these categories, your transformation objective needs to be defined more precisely before any measurement begins.
Question 2: Where are you in the transformation journey?
The metrics that matter in month one are not the same as those that matter in month twelve. Measuring ROI before adoption has stabilized is premature. Measuring adoption rates after two years signals you are tracking the wrong thing.
Phase
Focus your measurement on
Current-state benchmarks, digital readiness scores, change resistance indicators
Early rollout (0–6 months)
Adoption rates, training completion, time-to-proficiency
Mid-transformation (6–18 months)
Operational efficiency gains, process automation rates, employee productivity
Mature/optimization (18+ months)
ROI on digital investments, revenue impact, customer retention, market share
A common mistake is applying outcome-level KPIs (like ROI) during the rollout phase, then concluding the transformation is failing when adoption is simply still in progress.
Question 3: Who needs to see the results?
Your measurement framework serves different audiences, and each one needs a different lens on the same data.
Stakeholder
What they care about
KPIs to surface
Business value, competitive position
Revenue growth, ROI, market share gains
Operations / IT leadership
System performance, process quality
Uptime, automation rates, time-to-market
Workforce impact, change adoption
Employee satisfaction, digital skills proficiency, retention
NPS, CSAT, customer effort score
Build your reporting structure around this. One master KPI dashboard with role-based views is far more useful than a single report that nobody reads in full.
Question 4: How frequently can you realistically measure this?
A KPI you cannot consistently measure is not a KPI — it is a wish. Before committing to a metric, confirm you have the data infrastructure to track it at the frequency it requires.
Measurement frequency
Suitable KPIs
System uptime, adoption rates, customer satisfaction scores
Process automation rates, employee productivity, time-to-market
Revenue growth, market share, employee retention, innovation metrics
ROI on digital investments, strategic competitive benchmarking
If you can only measure something once a year, do not list it as a primary KPI. Use it as a strategic checkpoint instead.
The practical output: a focused KPI shortlist
Once you have answered all four questions, you should be able to narrow your full KPI list down to 5–7 core metrics and 3–4 secondary monitoring metrics. This is the range most transformation leaders and analysts recommend – enough to give a complete picture, few enough to stay actionable.
"What gets measured gets managed. Keep the number of metrics small and manageable — ideally three to four, and at most seven key ones, because people cannot focus on multiple pages of data." — Martin Davis, CIO and Managing Partner, Dunelm Associates
Anything beyond 10 active KPIs typically signals that the transformation strategy itself lacks focus, not that measurement is thorough.
Key performance indicators for digital transformation
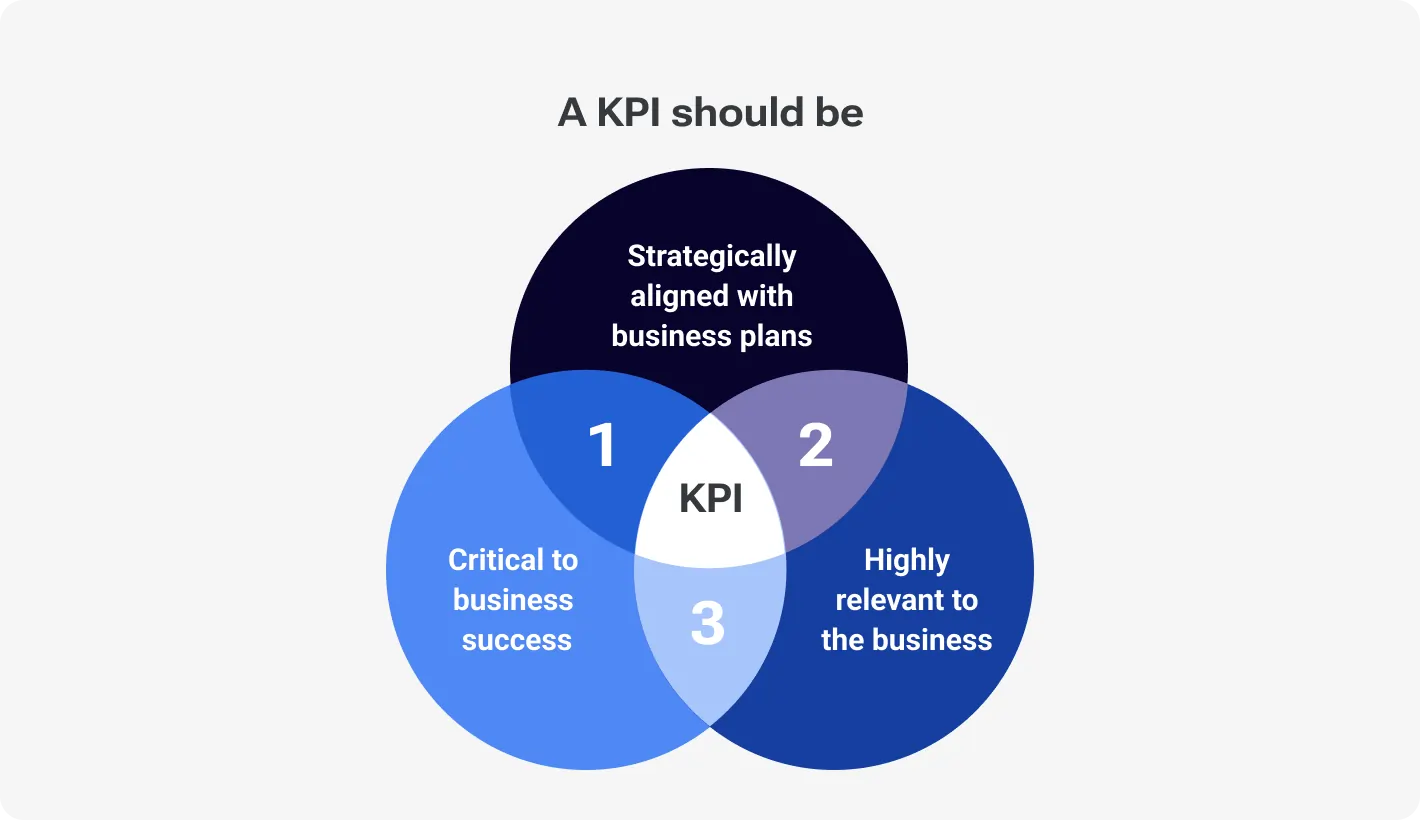
A Key Performance Indicator (KPI) is a way to measure the success of your company's activities. Include any KPIs in your initiative's planning; then, be prepared to measure them and report on the results.
Digital transformation KPIs, like any other type of performance measurement, can be both subjective and objective. They might track things that happen inside the organization or with your vendors, suppliers, and customers. Some KPIs measure the finer points of a project. Others are massive, gauging the solution's whole monetary value.
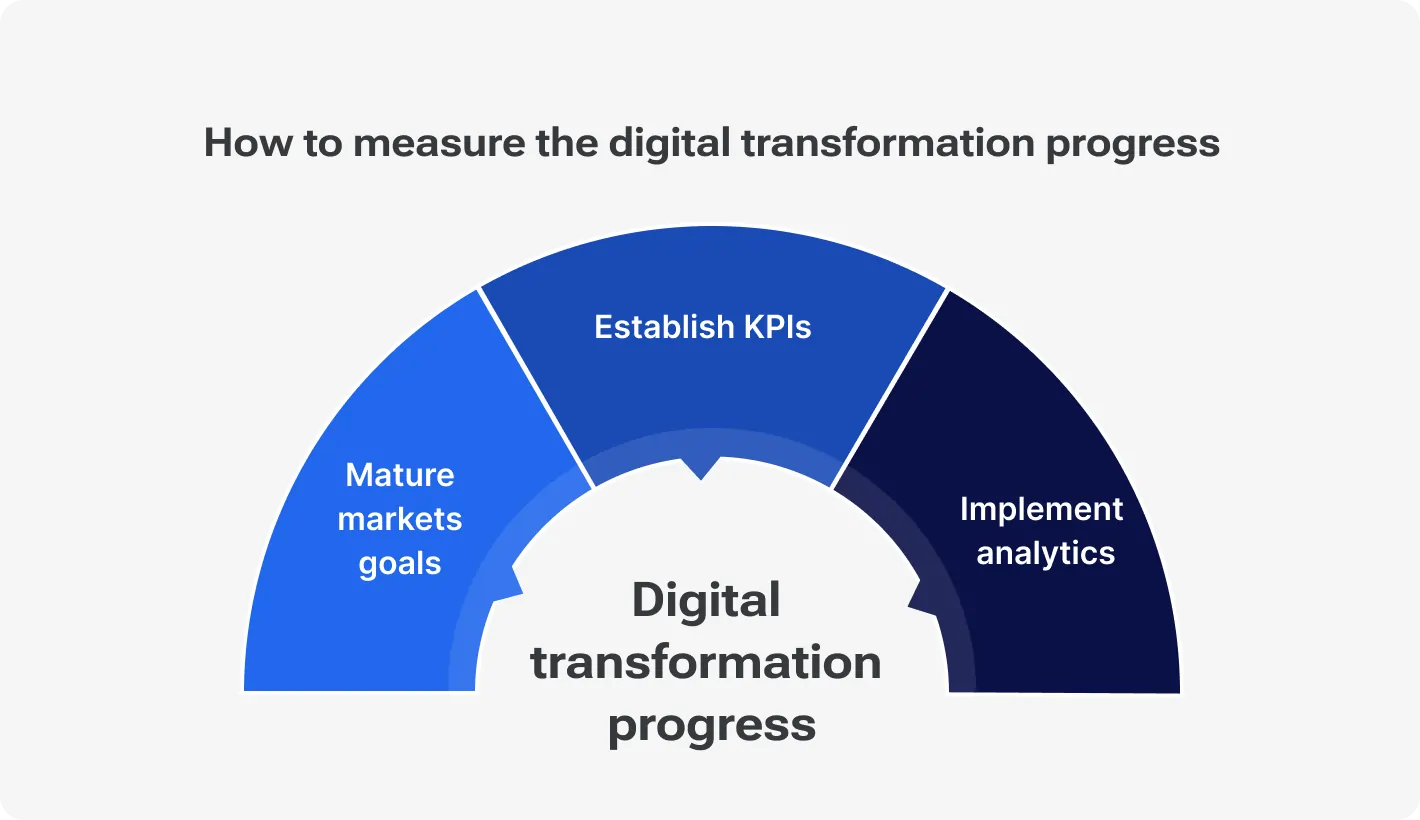
Transition to digital Infrastructure key performance indicators provides you with the details of deployment and consumption. These include keeping tabs on all applications that have been deployed, hardware that has been bought, and continuous development. Additionally, they track things like staff efficiency, consumer engagement, and digital adoption.
Nonetheless, key performance indicators for business outcomes must be included. The goal of digital transformation should be to increase value for the company, not only to improve technology. The number of licenses issued and the number of implementations mean little if digital solutions do not increase productivity, efficiency, and profitability.
The effectiveness of digital transformation depends on key performance indicators (KPIs) like agility, customer happiness, and return on investment (ROI). Learn about other key components of digital transformation in our blog.
To get a much more accurate picture of your digital transformation performance, try using these measurements and benchmarks instead of the old-fashioned ones:
1. Economic KPIs
Key performance metrics for digital transformation's financial effect include:
Metric
Formula
Description
((Current revenue - Previous revenue) / Previous revenue) * 100%
To measure the percentage increase in revenue over a specified period. A higher percentage indicates a successful increase in sales and overall business expansion.
(Total cost - Previous total cost) / Total cost * 100%
To measure the percentage reduction in total costs over a specified period. A higher percentage indicates greater savings and improved operational efficiency.
ROI on digital investments
(Benefits - Costs) / Costs * 100%
To compare the benefits gained from these investments against the costs incurred. A positive ROI indicates that the digital initiatives have generated more value than their initial costs, signaling profitability and sustainability.
Taken as a whole, these financial KPIs show how the company's digital transformation efforts are improving its financial health. By outlining the real advantages of digital technology adoption, they aid stakeholders in making informed choices about digital strategy and investment.
2. Customer-centric metrics
Businesses that want to improve their digital products would do well to study consumer reactions to digital transformation. This is an area that may benefit greatly from key performance indicators (KPIs) that center on customer happiness. Organizations that invest in improving their digital product offerings — as evaluated by the following key performance indicators — tend to have happier consumers, according to a McKinsey survey:
Metric
Formula
Description
((Number of detractors - number of promoters) / total respondents) * 100%
To gauge customer loyalty and satisfaction based on their likelihood to recommend a company's products or services to others. Positive NPS (Above 0) indicates more promoters than detractors, reflecting strong customer loyalty and potential for organic growth through positive word-of-mouth.
(Number of satisfied customers / total customers) * 100%
This metric measures customer satisfaction with a product, service, or overall experience. A high customer satisfaction rate indicates that customers are generally happy with the product or service, while a low rate suggests room for improvement.
(Number of retained customers / total customers) * 100%
This metric measures the percentage of customers who continue to do business with the company over a specific period. It's an indicator of customer satisfaction and loyalty. A high retention rate indicates strong customer loyalty and a low rate suggests potential issues with customer satisfaction or product/service quality.
By keeping an eye on these key performance indicators, businesses may learn how well their digital goods fulfill client demands. Firms may adjust their digital strategy to better meet the needs of their clients and boost overall company success with the aid of this feedback loop, which is vital for continual development.
Most transformations fail in execution, not planning. Devico closes that gap
3. Operational efficiency metrics
Metrics for operational efficiency are vital for gauging how well a company is using digital technology to improve efficiency and output. When it comes to measuring the efficacy of efficiency gains, the following key performance indicators (KPIs) stand out:
Metric
Formula
Description
(Number of automated processes / total processes) * 100%
To measure how automated the company's processes are. A process automation rate of 80% or higher indicates high digital maturity and efficiency, while a rate below 20% suggests minimal automation and significant room for improvement.
Time-to-market for new products/services
Average time-to-market for last 6 Months
To measure how quickly a business can launch new goods and services. An average time-to-market of less than 6 months indicates a competitive advantage and agility, while 12 months or more suggests slow innovation and potential competitive challenges.
Employee productivity metrics
(Output per hour worked / standard output per hour worked) * 100%
To evaluate the increase in productivity resulting from the use of digital technology, such as task automation, improved communication, and faster access to information. An employee productivity metric of 20% or higher indicates significant efficiency improvements, while -10% or lower suggests issues with engagement, training, or work processes.
By keeping an eye on these indicators, businesses can find out where digital technologies are making the most difference and where they have room to grow. Businesses can enhance their operations and achieve maximum efficiency and production via this continual examination.
4. Innovation metrics
Digital transformation requires adopting and implementing new technologies. Companies must provide a flexible and secure infrastructure to enhance processes as they grow.
The following KPIs assist a corporation assess its technical adaptability and business objectives alignment.
Metric
Formula
Description
Number of new digital products/services launched
Number of new products/services launched in last quarter
A company's total number of new digital products released during a certain period is quantified by this measure.
5 or more new digital products or services launched in the last quarter, indicating a strong focus on innovation and adaptation.
Average Time-to-market for new products/services in last quarter
The rate of solution or improvement development and implementation is measured by this statistic.
Average Time-to-Market of 3 months or less, indicating a rapid pace of innovation and adaptation.
Agility in responding to market change
Number of successful adaptations to market changes in last quarter
This indicator measures the agility with which a business may change its course in reaction to shifting market circumstances. 3 or more successful adaptations to market changes in the last quarter, indicating a high level of agility and adaptability.
Organizations may stay ahead of the digital race by keeping an eye on these metrics. This allows them to adapt and innovate more quickly to meet customer requests and expectations. To drive sustainable development and retain a leadership position in the market, it is vital to strategically concentrate on innovation metrics.
5. Employee-focused metrics
How your staff is being impacted by your digital transformation initiatives. Is the introduction of new digital goods and procedures boosting morale and productivity, or is it having the reverse impact?
Your workers may not be very enthusiastic about the technological developments at your organization. After all, the Digital Transformation Report by Jabil found that cultural changes are more challenging to handle than technical ones during digital transformation.
Consequently, your HR team should be monitoring the following KPIs in addition to revenue, technology, and customer-based return on investment (ROI):
Metric
Formula
Description
Employee satisfaction scores
Average employee satisfaction score in last quarter
Monitors how contented workers are with their jobs. Average employee satisfaction score of 4.5 or higher, indicating a positive and supportive work environment.
Digital skills proficiency levels
Percentage of employees with proficient digital skills in last quarter
Measures employee competency in new digital technologies. 80% or higher proficiency level in digital skills, indicating a well-equipped workforce.
Percentage of employees retained in last quarter who worked on digital initiatives
Keeps tabs on how many workers who worked on digital initiatives end up staying behind. The higher the rate the better.
A motivated and competent staff may be sustained with the use of these measures.
6. Market and competitive metrics
Monitoring these market-focused KPIs can help you remain competitive:
Metric
Formula
Description
Increase in market share over last quarter
It indicates that the organization is gaining ground in its industry or market, while a negative gain suggests that it is losing market share. This metric helps organizations track their progress and adjust their strategies accordingly.
2% or more market share gain over the last quarter, indicating successful growth and competitiveness.
Average competitor score on digital skills assessment tool in last quarter: our score / competitor score * 100% >= 80%
A score of 80% or higher indicates that the organization is competitive in terms of digital skills proficiency, while a lower score suggests that there is room for improvement. This metric helps organizations assess their strengths and weaknesses relative to their competitors.
Analyzing brand sentiment
Employee retention rate for digital activities in last quarter: >= 90%
A high retention rate indicates that employees are engaged and satisfied with their work on digital initiatives, while a low rate may suggest that employees are leaving due to dissatisfaction or lack of engagement. This metric helps organizations identify potential issues with job satisfaction, engagement, or career development opportunities.
By monitoring these KPIs, companies may better understand how their digital transformation initiatives affect their workforce and make educated choices to create a healthy and productive workplace.
7. Technology adoption metrics
Use these key performance indicators to assess the uptake and dependability of digital technologies:
Metric
Formula
Description
Adoption rates of new technologies
((Number of employees Who Have Adopted new technology / total number of employees) * 100)
A high adoption rate indicates that employees are embracing new technologies, while a low rate may suggest resistance to change or difficulties with training and support. This metric helps organizations evaluate their deployment strategy and identify areas for improvement.
Uptime and reliability of digital systems
(Total system uptime / (total system time - downtime)) * 100
A high uptime percentage indicates that digital systems are reliable and available for use, while a low percentage suggests potential issues with system reliability, maintenance, or hardware failures. This metric helps organizations assess the availability and reliability of their digital systems.
Scalability of infrastructure
((Maximum concurrent users / average server Load) * 100)
A high scalability score indicates that the digital infrastructure can efficiently handle growing loads and demand, while a low score suggests potential issues with infrastructure capacity or bottlenecks. This metric helps organizations assess the ability of their infrastructure to adapt to changing demands.
To be competitive and resilient in the ever-changing digital market, organizations must regularly monitor this measurement framework to measure the performance of their digital activities and make educated choices to continually enhance their technology skills and infrastructure.
The complete guide to digital transformation
What most companies get wrong when measuring digital transformation
Knowing which KPIs exist is not the same as measuring transformation effectively. According to BMC Software's analysis of McKinsey's Digital Quotient research, fewer than 15% of organizations relying on financial KPIs alone can accurately quantify the ROI of their digital transformation investments. The metrics are there. The measurement discipline is not.
These are the most common mistakes — and what to do instead.
Mistake 1: Measuring outcomes before adoption has stabilized
This is the most frequent and most damaging error. A company rolls out a new platform, checks ROI at the three-month mark, sees underwhelming numbers, and either pivots prematurely or loses executive buy-in entirely.
The problem is not the transformation. It is the timing of the measurement.
Outcome-level KPIs — revenue impact, cost savings, ROI — only become meaningful after the workforce has genuinely adopted the new tools and processes. If your digital adoption rate is at 40%, your productivity metrics will look worse than before the transformation started. That is expected. Measuring it as a failure is a strategic error.
What to do instead: Set phase-appropriate KPIs from the start. Track adoption and proficiency metrics in the first six months. Introduce efficiency and output metrics only after adoption crosses a meaningful threshold — typically 70–80% across the affected teams.
Mistake 2: Tracking activity, not outcomes
This is where vanity metrics quietly undermine transformation programs. Companies report impressive numbers — licenses deployed, training sessions completed, tools integrated, workshops run — and mistake activity for progress.
None of these answer the only question that matters: is the business performing differently because of this transformation?
Common activity metrics mistaken for outcome metrics:
Number of digital tools deployed
Number of employees trained
Number of processes "digitized"
IT tickets resolved post-migration
These are inputs. They tell you what happened. They do not tell you whether it worked.
What to do instead: For every activity metric you track, define its corresponding outcome metric. Tools deployed → adoption rate and time-to-proficiency. Employees trained → digital skills proficiency score and productivity delta. Processes digitized → cycle time reduction and error rate.
Mistake 3: Using the same KPIs across every department
A single transformation program affects finance, operations, customer success, HR, and IT simultaneously — but each function experiences it differently and at a different pace. Applying identical KPIs across all of them produces data that is technically accurate and strategically useless.
Your customer success team measuring NPS during a backend infrastructure migration tells you almost nothing. Your IT team measuring employee satisfaction scores during a customer portal rollout is equally misaligned.
What to do instead: Segment your KPI framework by function and transformation phase. Each team should have two or three KPIs that reflect their specific role in the transformation, feeding into a smaller set of company-wide strategic indicators that leadership tracks.
Mistake 4: No pre-transformation baseline
You cannot measure change without knowing where you started. Yet a significant number of organizations begin digital transformation initiatives without documenting their current-state performance across key dimensions — process cycle times, error rates, customer satisfaction scores, employee productivity benchmarks.
When results are eventually measured, there is nothing to compare them against. The transformation may have driven real improvement, but without a baseline, it cannot be demonstrated — to leadership, to the board, or to the teams who need to see evidence that the disruption was worth it.
What to do instead: Before any transformation initiative moves past the planning phase, run a baseline measurement sprint. Document current performance across every KPI category you intend to track. Treat this data as a contractual reference point, not an optional starting exercise.
Mistake 5: Treating measurement as a reporting function, not a decision function
Many organizations measure their digital transformation thoroughly — and then use the data primarily to produce status reports. Dashboards are built, decks are assembled, and metrics are shared in quarterly reviews. The data is visible. It is not actionable.
Measurement only creates value when it drives decisions. If a KPI is consistently reviewed but never triggers a change in strategy, resource allocation, or execution, it is a reporting exercise — not a management tool.
What to do instead: For each KPI in your framework, define in advance: what threshold triggers a review? What threshold triggers a course correction? Who is responsible for making that call? Building decision rules into your measurement framework before the transformation begins is what separates organizations that learn from their data from those that merely collect it.
Mistake 6: Letting the KPI list grow unchecked
Transformation programs tend to accumulate metrics over time. A new stakeholder joins and wants a new metric tracked. A new tool gets deployed and generates new data. Within eighteen months, a focused 7-KPI framework has quietly expanded to 30+ indicators that no single person can interpret or act on.
More metrics do not produce more clarity. They produce more meetings, more competing priorities, and more noise around the signals that actually matter.
What to do instead: Conduct a quarterly KPI audit. For each metric in your framework, ask: did this drive a decision in the past 90 days? If the answer is consistently no, retire it or demote it to a background monitoring metric. Keep your active KPI set at 5–7 core indicators at all times.
We help companies transform faster, with less risk and measurable ROI at every stage
Best practices for success measurement and analysis
If digital transformation initiatives are to provide the expected results and guarantee ongoing progress, it is crucial to measure and analyze their performance effectively. Organizations may build a strong foundation for monitoring progress and making smart choices by adhering to best practices.
-
Establish specific and quantifiable goals
It is critical to establish specific and quantifiable goals before deciding on key performance indicators. To be sure that your KPIs are in line with your company goals, these objectives should serve as a basis. To become a digital industrial business, General Electric (GE) established explicit objectives for digital transformation. They laid up goals including expanding their digital product line's income potential and boosting productivity. It might be difficult to define success and establish reliable metrics in the absence of clear goals.
-
Align KPIs with business goals
You can make sure that the metrics you measure are relevant and provide you with meaningful insights by choosing KPIs that are in line with your company objectives. By using the "two-pizza team" model to guarantee focused and agile project management, Amazon demonstrates how to match key performance indicators with corporate objectives. This method allows them to monitor development in a manner that bolsters their overarching goals of innovation and happy customers.
-
Make sure analytics tools and data collection methods are reliable
Accurate measurement and analysis rely on trustworthy data-gathering techniques and strong analytics tools. Improved service dependability and customer happiness were the outcomes of Microsoft's use of sophisticated analytics technologies for monitoring and refining its cloud services. If you want to be sure that the data you analyze is accurate, up-to-date, and thorough, then you need to make sure that you're using the correct technologies and methods for data collecting.
-
Ongoing monitoring and reporting
The only way to keep tabs on developments and spot patterns is via consistent reporting and monitoring. Netflix makes data-driven decision-making choices about content production and acquisition by continuously analyzing user engagement and content performance. Organizations may quickly resolve problems, identify trends, and make educated digital strategy modifications by routinely examining KPI data.
-
Incorporate data for better decisions and ongoing development
Decisions that foster continual improvement should be informed by measurement data. IBM used this method by improving its strategy and technology offerings with the help of data gathered from its digital transformation activities. The success and continuation of digital transformation projects depend on the analysis of KPI data, which aid in the identification of improvement areas and provide a foundation for strategic planning.
-
Improve measuring techniques over time
It is vital to adapt measuring techniques regularly in response to feedback and changing needs as business demands and circumstances change. Accenture maintains its competitive advantage and effectiveness by regularly updating its digital strategy in response to market trends and client feedback. Regularly reviewing and updating your key performance indicators and measurement procedures can ensure that they continue to drive your company's success.
How to interpret measurement data and gain actionable insights
When utilized correctly, key insights obtained from measurement data may inspire strategic decisions and operational improvements. Consider the following approaches:
Outline your goals and key performance indicators (KPIs). To ensure success, define quantifiable goals that are in line with the company's overall objectives. This ensures that the information the organization gets is relevant and useful in attaining its goals. Once the defined KPIs and objectives for the data analysis project are established, everyone on the team will understand their position and how to perform it.
Visualize data. Use heat maps and dashboards more efficiently to identify trends, patterns, and anomalies. By leveraging visualization, decision-makers may readily interpret complicated data sets and gain sophisticated insights just by looking at them. Organizations might improve decision-making speed and quality by turning raw data into visually attractive and readily accessible representations.
Predictive analysis. Extrapolate patterns from historical data using complex statistical models and machine learning methodologies. Using this strategy may help you predict difficulties and seize opportunities before they arise. Companies may utilize predictive analytics to plan rather than react to market developments or client behavior.
Reviews and changes. Create a practice for assessing data insights and revising strategy as necessary. Being responsive allows the business to be in tune with what the market needs and desires for itself. To remain agile and capable of responding quickly to changing situations, strategies must be reviewed and adjusted regularly in light of new data insights.
Digital transformation is only as good as its execution. We handle both
To improve operations, get a deeper knowledge of consumers, and create creative products, top firms are increasingly using data. Among the most important ways they are accomplishing this is:
-
Amazon predicts consumer demand and optimizes warehouse inventory using advanced analytics. By looking into what customers have bought in the past, Amazon may adjust inventory levels, prices, and customer satisfaction.
-
Starbucks uses GIS and location-based data to choose shop locations. Starbucks optimizes market penetration by analyzing consumer demographics, shop performance, and traffic patterns.
-
Nike uses app use and customer input to improve product designs and marketing tactics. Nike innovates and stays ahead in a competitive market using data.
Today's economic climate necessitates rapid adaptability. Agile data-driven businesses may change their approaches in response to fresh information. This adaptability helps to mitigate risks and capitalize on market possibilities.
Learning from data and using those insights to strategy provides businesses an advantage. Real-time data analytics improves strategy effectiveness by accelerating decision-making. Businesses must actively use data to improve and modify strategy.
Conclusion
It is critical to be adaptable in terms of strategy changes. In today's fast-paced corporate environment, being adaptable and sensitive to changing data and market circumstances is critical for reducing risks and capitalizing on new opportunities as they occur. Businesses can remain ahead of the competition and get a solid ROI from their digital transformation activities if they consistently learn from measurement data.
Feel free to get in touch with us whenever you are prepared to take the next step in improving your company's digital transformation strategy using accurate evaluation. If you need advice or need help improving your strategy for measuring digital transformation, the Devico team is here to help.
Struggling to keep up with the competition due to outdated technology?