A conventional situation: you own a fitness app. Imagine, then, the slow, insidious creep of unseen problems — code rot, architectural flaws, shortcuts taken under pressure. Technical debt, the unseen mortgage on your app's future, accumulates silently, interest compounding with each new feature and each delayed upgrade. MIT study found that complex software systems can incur up to 300% more maintenance costs than well-designed ones. But what is even more devastating is that the modernization efforts of 79% of companies are falling flat.
Probably the most famous example of an unequal technical debt ratio is Equifax, 2017. A single, seemingly innocuous vulnerability in their software exposed the personal data of 147M Americans, costing the company over USD 700 million in fines and settlements. Well, this is the technical debt price.
Ignoring it, to be more precise. Every bug fix, every clunky workaround, every feature delayed by spaghetti code siphons precious resources from building the future.
Measuring technical debt is like a magic tool in this case. It's about making informed decisions, prioritizing investments, and steering your business toward a future where innovation, not technical cobwebs, defines your competitive edge.
How Does Technical Debt Impact Your Business?
KcKinsey once shot with a very accurate comparison: tech debt ratio is like a dark matter; you are completely sure it’s real, but at the same time, you can’t see or gauge it. That’s why 30% of CIOs from high-revenue companies spend at least 20% of innovations’ budget on tech debt remediation. Understanding the impact of code debt and how to measure technical debt in your business is paramount for CEOs, CTOs, and executives navigating the delicate balance between innovation and infrastructure stability.
Empower your IT team to focus on innovation and growth by outsourcing your technical debt management
Below, we have highlighted two main effects — they are the most influential ones.
Impact #1: Performance Degradation. Across industries, one of the most pervasive impacts of technical debt is the gradual decline in system performance. 2020 McKinsey’s Survey reveals that the financial sector is the most affected by technical debt. They are 50% more likely to experience performance issues.
Impact #2: Innovation Bottlenecks. Any company wants to grow. Especially technology-driven companies. And in this case, code debt can act as a stifling force, impeding innovation. A report from Carnegie Mellon University highlights that in the software development industry, nearly 70% of companies attribute delayed release cycles due to accumulated technical debt.
In any case, it’s always more convenient to break down abstract information on practical examples. Let’s give a couple from different niches.
#1 E-commerce: Time to market is crucial. Every delay in an online store translates to lost conversions. Elastic Path found that 47% of visitors expect the page to load in only 2 sec. Even a one-second page load delay can lead to a tangible reduction in conversions.
Example: In 2020, Macy's online platform buckled under Black Friday traffic, with shoppers facing error messages and long wait times. But what’s most ironic — that wasn't a hardware issue. Rather the culmination of years of technical debt, left Macy's PR efforts going down the drain.
#2 SaaS: Subscriptions hinge on reliability. For SaaS companies, every glitch, every downtime event, is a churn magnet. According to the 2017 AppAttention Index, 80% of users would abandon a SaaS platform after just one bad experience. Well, it’s an impact of tech debt for sure.
Example: In 2018, Zenefits, a rapidly growing HR platform, experienced a series of system outages due to its monolithic architecture. All tech debt issues added up to the scandal. This cost them about USD 1M of fines and additional resources for rebranding.
Technical Debt Challenges
Confronting code debt and technical debt measurement are no walk in the park. CEOs, CTOs, and executives must navigate its complexities strategically. Below, we have listed five key challenges.
-
Subjectivity in Measurement: When measuring tech debt, the process is not as clear as, for example, assessing marketing efforts. Also, unlike financial metrics with clear numerical values, technical debt is often subjective and context-dependent. Understanding the specific business context comes before quantifying the impact of shortcuts and outdated technologies.
-
Balance: Let’s face it, devs burnout mostly because of the pressure to deliver results quickly. Such a rush culture inevitably leads to decisions that prioritize short-term gains over long-term sustainability. All tools of the trade are not used accordingly, and technical debt accumulation becomes a persistent challenge for decision-makers.
-
Gap Between Technical and Non-Technical Stakeholders: Connecting people is probably the most difficult part of collaboration. Especially when it comes to tech and non-tech specialists. Technical debt discussions often involve complex jargon and technical nuances that may be challenging for non-technical leaders to grasp fully, hindering informed decision-making. But jargon is not a big deal. More important to explain the importance of the allocation of resources for its remediation. And to get all the leaders on the same page.
-
Technology Stack Evolves, Too: Technology evolves. So does technical debt. What may be considered best practice today could become a source of technical debt tomorrow as new technologies emerge. This makes it challenging to develop standardized metrics and approaches for measuring technical debt across diverse tech stacks.
-
Resource Allocation Dilemma (One More Time): Turning back to resource allocation, companies often grapple with such a dilemma. Addressing existing technical debt and investing in new projects are absolutely different directions in budgeting. For this reason, striking the right balance is critical. Too much focus on legacy issues can impede innovation, while neglecting technical debt may lead to a cascade of operational challenges.
Any code you write is going to be legacy code someday, so it’s important to write it well,
— Martin Fowler, renowned software architect and author
8 Metrics for Measuring Your Technical Debt
Just to clarify: you hardly run your business without tracking financial metrics, innit? Similarly, effective technical debt tackling deeply hinges on a precise understanding of its impact on your software development process and objective data. Below, we’ve listed eight key metrics you don’t want to neglect if you still want to grow and improve your software development process.
NB: each metric sheds light on specific aspects of the codebase.
NB 2: whenever you find a new “piece” of technical debt, document it: the reason, the impact, and the remediation plan.
1/ New Bugs vs. Closed Bugs
The process is very similar to any apocalyptic computer game: you are trying to get rid of enemies, and with each wasted one, there are two new ones to waste. Weird comparison, but still. This metric evaluates the rate at which new bugs are identified versus the rate at which existing bugs are resolved. A higher ratio of new bugs indicates a potential increase in technical debt and, hence, “tech death”.
2/ Debt Index
Think of this as your credit rating for code quality. In general, that means various metrics like complexity, duplication, and age. At the end of the day, the Debt Index assigns a score that reflects the overall "financial health" of your codebase. Eventually, you get something like a snapshot of technical debt to consider various factors such as code complexity, duplication, and potential bugs.
But note that the construction of the index can be subjective since that’s you who decides which metric to include. Also, it may oversimplify technical debt in terms of its complexity. But still, the Debt Index offers a high-level overview and is useful for management and stakeholder communication.
3/ Code Quality
In this case, you can take advantage of external consultants or just attract tech specialists from other departments to assess code quality. Usually, it’s about analyzing adherence to coding standards, readability, and maintainability. Not always, but often — a decline in code quality correlates with increasing technical debt. Tools like SonarQube provide detailed code quality reports, highlighting areas needing attention. We will delve into the tool in the next section.
How to avoid tech debt in software implementation
4/ Cycle Time
Cycle Time measures the time it takes to move a task from development to production. Prolonged cycle times may indicate underlying technical debt, as streamlined processes are crucial for efficient development and deployment. Reducing cycle time boosts agility and uncovers hidden roadblocks caused by debt. This way, you’re allowed to prioritize roadblocks removal.
5/ Code Churn
How often do you change your code? Simply put, this metric shows how often. High code churn can signal a lack of stability. Thin over the fact that permanent modifications may lead to new issues and complicate future development efforts. Identify modules with excessive churn and investigate: are you patching debt-ridden areas instead of addressing the root cause?
6/ Code Coverage
Code Coverage evaluates the proportion of code tested by automated tests. Low code coverage signifies blind spots, areas where technical debt may be festering undetected. Leverage automation to increase your test coverage.
7/ Code Ownership
This metric is often perceived negatively. But it is not about fault-finding, it is about tech debt remediation. Understanding who owns specific parts of the codebase is vital. Lack of clear ownership can lead to neglect, making it challenging to address code debt in a systematic manner.
8/ Technical Debt Ratio
Technical debt ratio (TDR) represents the percentage of work in the codebase that is considered technical debt. A higher TDR indicates a higher proportion of the codebase requiring attention. But it also has some limitations:
Also has some touch of subjectivity.
Doesn’t pay attention to architectural issues and other non-code aspects of technical debt.
Code can contain non-quantifiable aspects of tech debt, and this metric might not reflect their impact.
Bonus
There is a thought to mull over: the approach to technical debt measurement involves analyzing the "bus factor." This metric assesses how many team members need to be incapacitated (hit by a metaphorical bus) before a project becomes unsustainable. By understanding the bus factor, organizations can identify critical dependencies and mitigate potential risks more effectively. Sounds cynical a bit, but still.
By the way, you can always go beyond standard metrics and consider advanced techniques like cognitive complexity analysis. This delves into the "cognitive load" imposed by your code, revealing areas that are mentally taxing for developers to understand and maintain.
The Best Tools for Measuring Technical Debt
We’ve elaborated on what to measure. And now, it’s time to set out how to measure technical debt. As CEOs, CTOs, and executives grapple with the complexities of software development, leveraging specialized tools can provide valuable insights into the health of their codebase. Here, we explore five tools for this case.
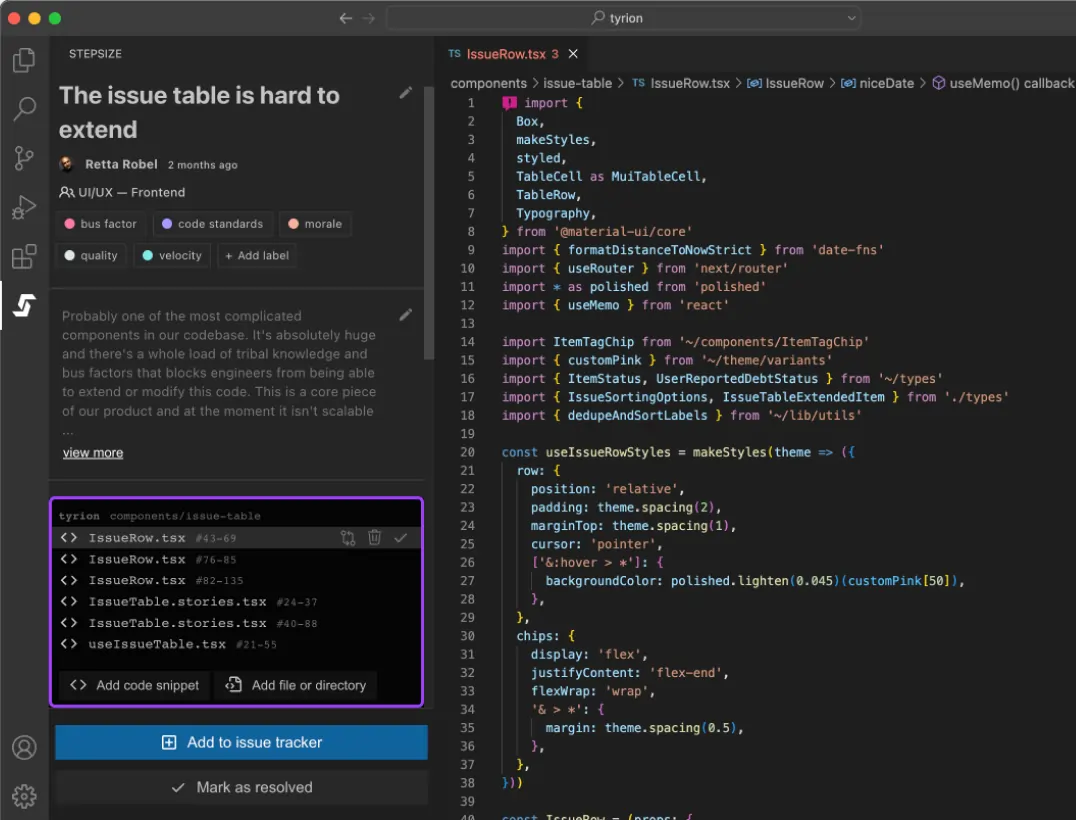
Stepsize
Stepsize is an intuitive platform that integrates seamlessly into your development workflow, offering insights into technical debt. Probably the most important benefit is that all operations run in real-time. The tool provides visibility into how code changes impact overall debt, making it a valuable tool during code reviews and collaborative development efforts. This data-driven approach can be a game-changer in securing buy-in from stakeholders who appreciate an ROI increase the most. Use Stepsize when you need a compelling argument for technical debt remediation, particularly in companies focused on bottom-line impact.
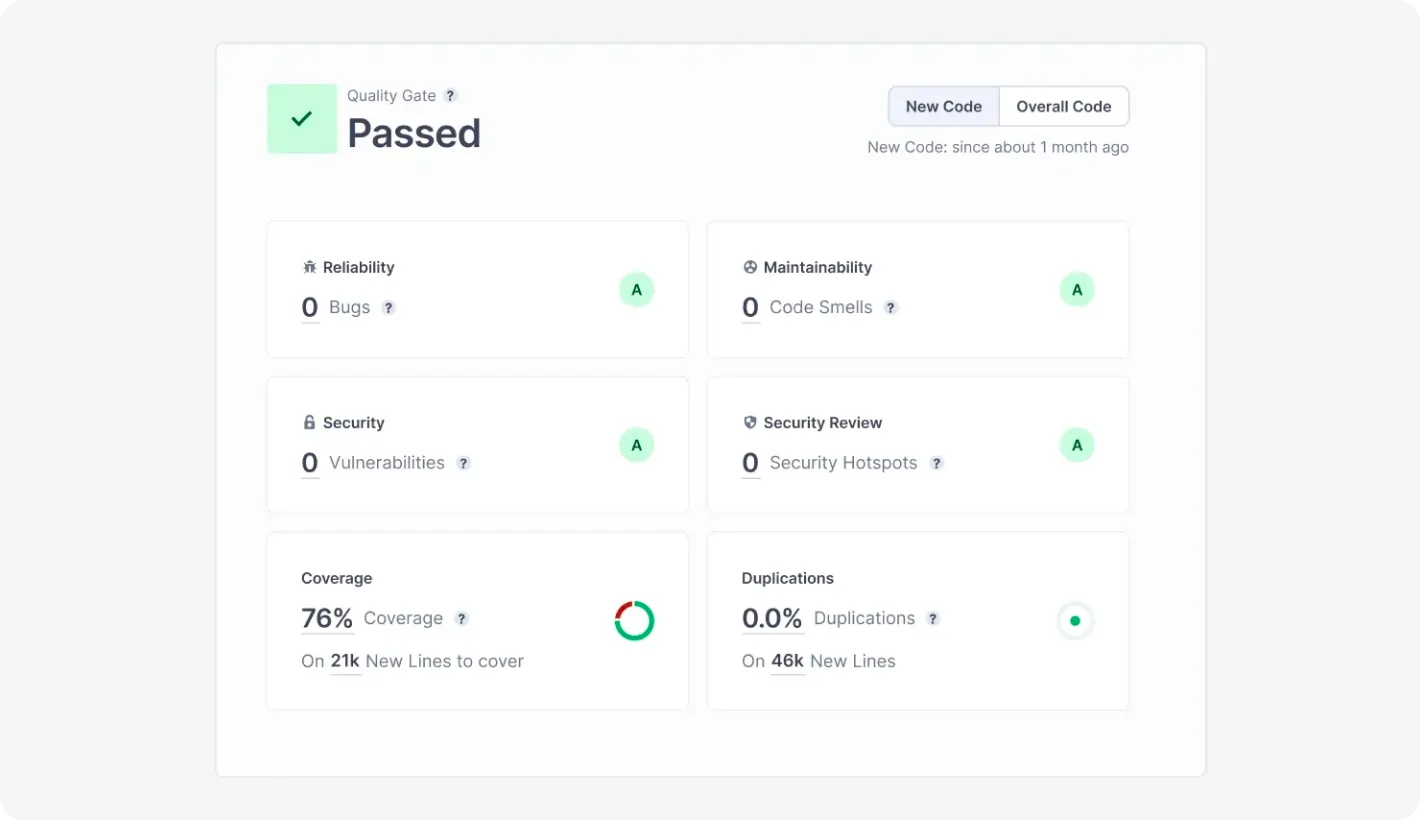
SonarQube
Want to check code quality and obtain a security analysis tool all rolled into one? SonarQube is such a comprehensive tool that stands out for its ability to assess technical debt. Simply put, it checks code maintainability, reliability, and security. Its integration capabilities with popular CI/CD pipelines make it an ideal choice for organizations focused on continuous code improvement. Something like a code's MRI, providing a detailed diagnosis of its overall health. Use SonarQube for ongoing code quality monitoring and identifying potential technical debt hotspots to nip it in the bud.
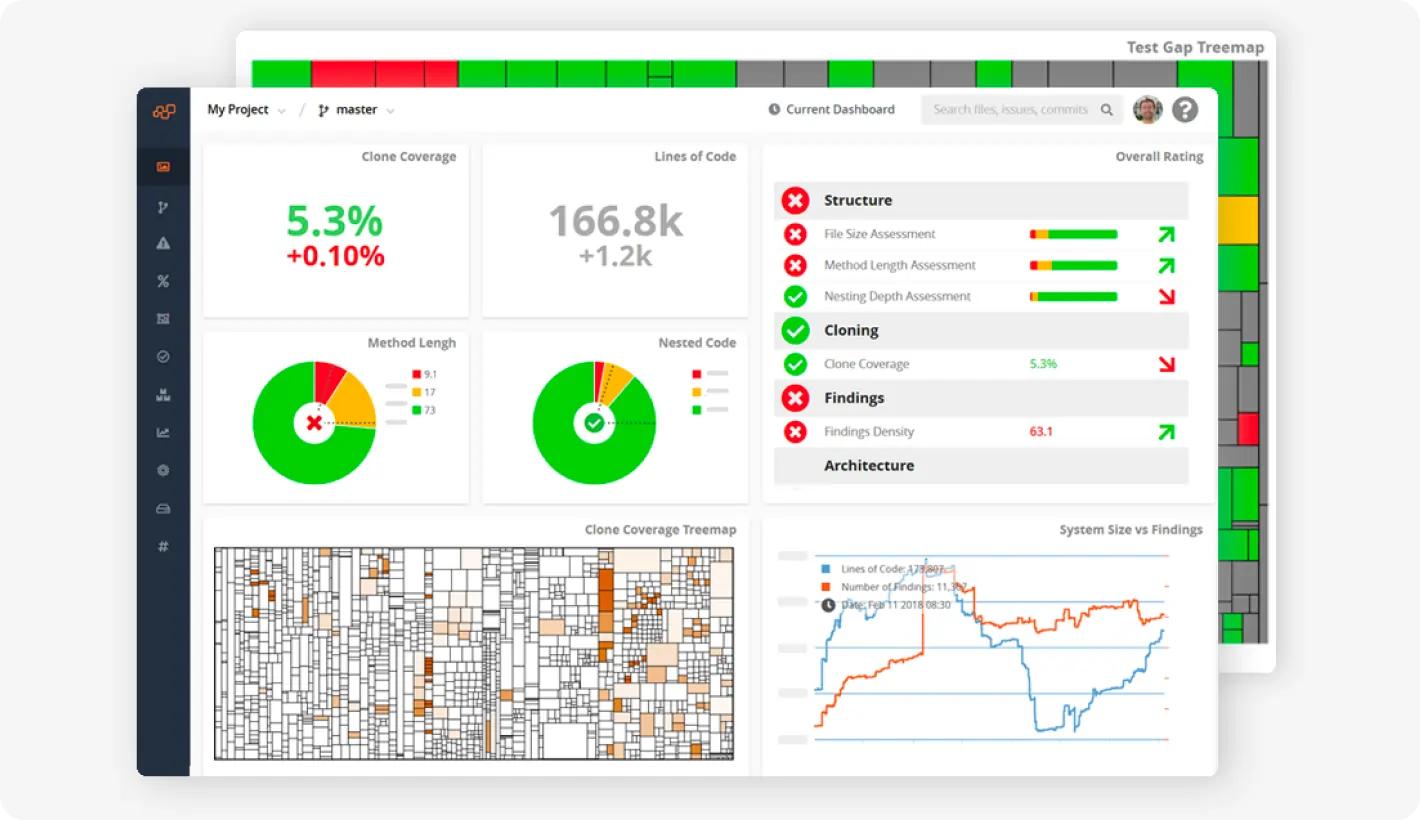
Teamscale
Another tool that offers a holistic approach to technical debt measurement by analyzing code patterns, architecture, and test coverage. If your company has complex codebases, this tool is your choice since it provides actionable insights into areas that require attention. Teamscale's strength lies in its ability to adapt to diverse development environments and provide tailored recommendations for minimizing technical debt. Use Teamscale when you're planning major system upgrades or experiencing chronic headaches with integration and maintenance.
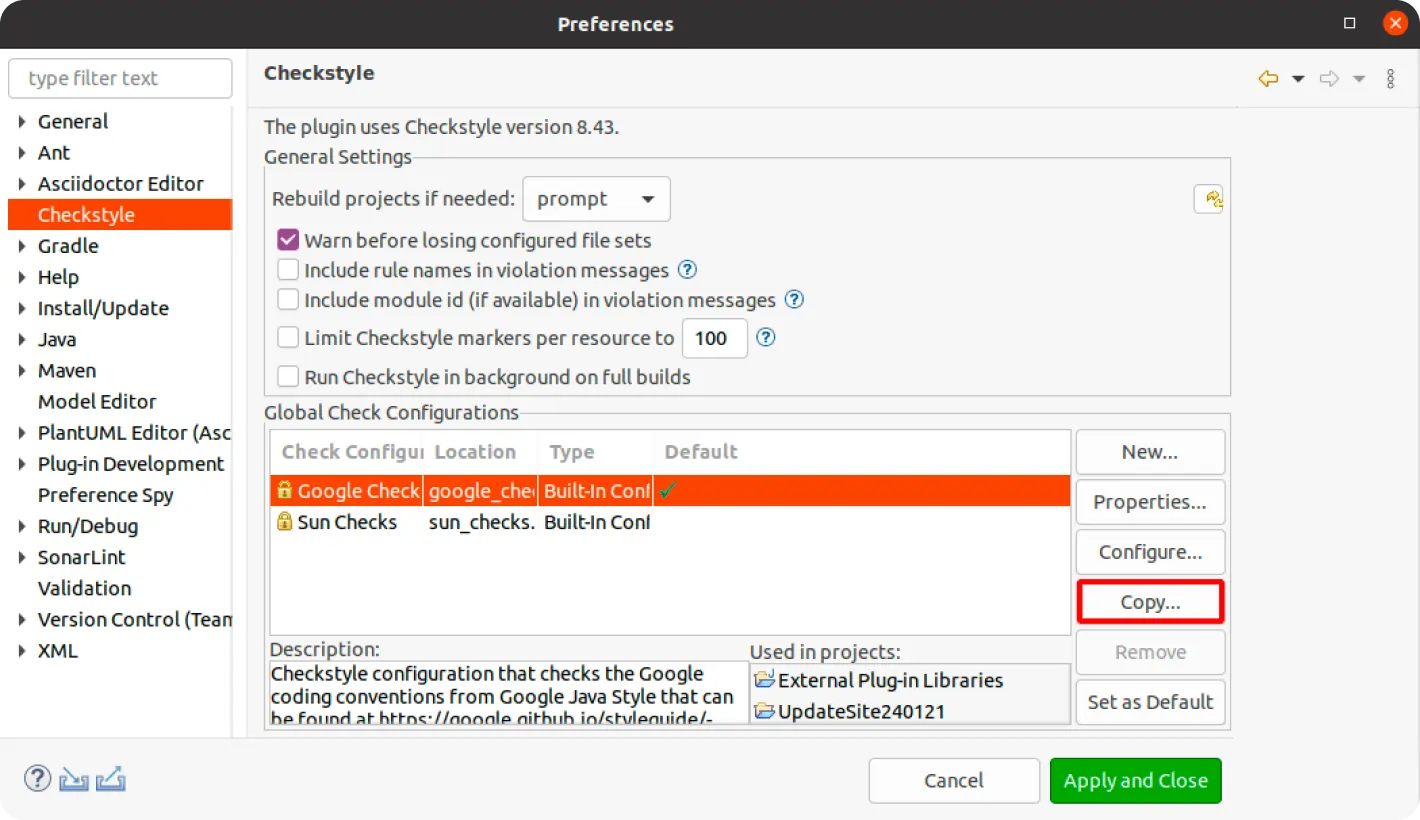
Checkstyle
Checkstyle is a versatile static code analysis tool that emphasizes adherence to coding standards. While not explicitly a technical debt tool, Checkstyle aids in identifying code smells and potential areas of improvement. It is particularly useful for organizations prioritizing code cleanliness and consistency as part of their technical debt management strategy.
Mend.io
Mend.io focuses on automating the remediation of technical debt by providing actionable suggestions directly within your IDE. It excels in assisting developers during their day-to-day coding activities, offering real-time feedback and guidance. It could be compared to a cybersecurity guardian, constantly scanning for vulnerabilities that could become costly exploits. Use Mend.io when security is paramount, especially in applications handling sensitive data or critical infrastructure.
To sum it up
Let’s face it, nowadays, technology is the linchpin of success. But there is a thing — technical debt. And managing tech debt is a real pain in the neck for CTOs, CEOs, and other C-suite executives.
Well, statistics underscore the significance of its remediation. The 2022 CISQ report reveals that technical debt and overall poor software cost the US economy an astonishing USD 2.41T, a staggering figure that should jolt organizations into action. Neglecting technical debt not only jeopardizes the stability and resilience of software systems but also exacts a considerable financial toll.
For this reason, wanted to make a point: tackling technical debt is a journey, not a destination. Start by measuring tech debt using the metrics we discussed, prioritize the most critical areas, and then deploy your chosen weaponry, be it the financial firepower of Stepsize, the comprehensive health check of SonarQube, or the targeted precision of Checkstyle.
Gain long-term savings through the prevention of costly disruptions and inefficiencies