We can’t help but admit: DevOps strategy has emerged as a game-changer. It became a transformative approach that bridges the gap between development and operations teams, fostering collaboration and efficiency throughout the software development lifecycle. DevOps practices have become instrumental in delivering high-quality software at scale and speed, making it an indispensable part of modern software development.
DevOps, as a philosophy and set of practices, is only as effective as the results it delivers. To ensure that your DevOps implementation is on the right track and providing tangible benefits, you need a way to measure its success. This is where DevOps metrics and Key Performance Indicators (KPIs) come into play.
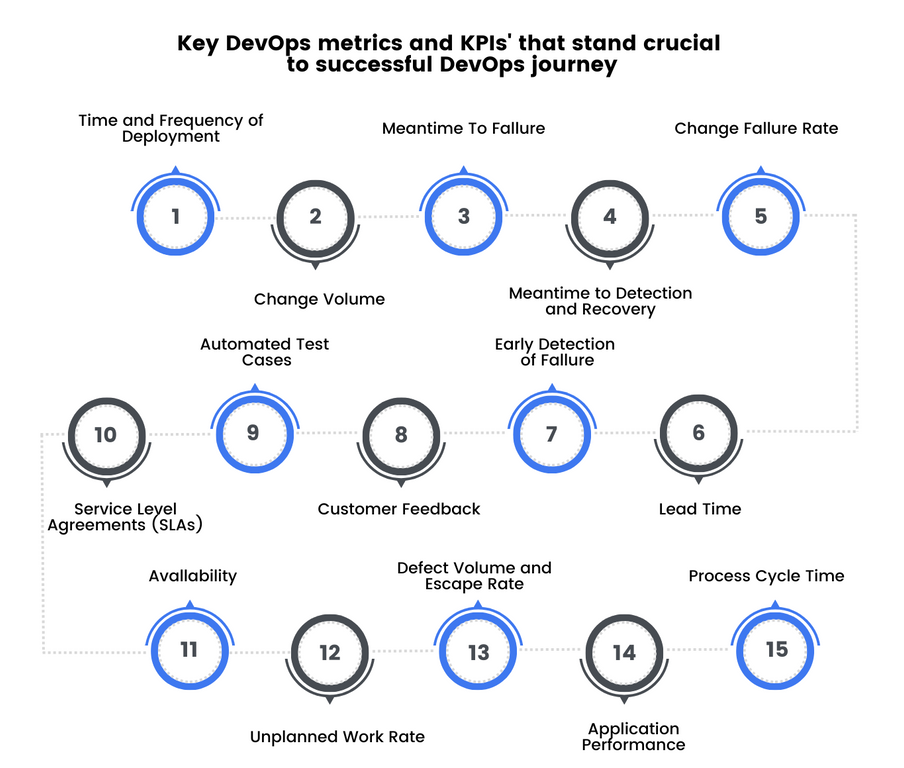
An extended list of DevOps metrics. But note this is not a plug-and-play thing. Experiment, track, and adapt
They provide quantifiable insights into the performance of your DevOps processes. They help you assess whether your teams are achieving the desired outcomes and meeting business objectives. Without these metrics, it's challenging to identify areas for improvement or track progress effectively.
DevOps is not just about adopting the latest tools or implementing automation. Its true value lies in aligning these practices with broader business objectives. Organizations that excel in DevOps leverage KPIs to ensure that their efforts are in sync with what matters most to the company's bottom line.
For example, if one of the strategic goals is to improve customer satisfaction, DevOps KPIs might focus on metrics related to system uptime, response times, and the frequency of critical incidents. By continuously monitoring these KPIs, organizations can identify issues proactively and make improvements that directly impact customer experience.
Just measure it
Nike, is that you? Calm down, no plagiarism. Just a little joke to help you bite the bullet and start measuring your DevOps metrics and KPIs. Have you encountered the traditional siloed approach, where development and operations teams worked independently? It often leads to inefficiencies, longer development cycles, and a higher probability of errors in production, isn’t it? This approach hindered innovation and responsiveness to market demands.
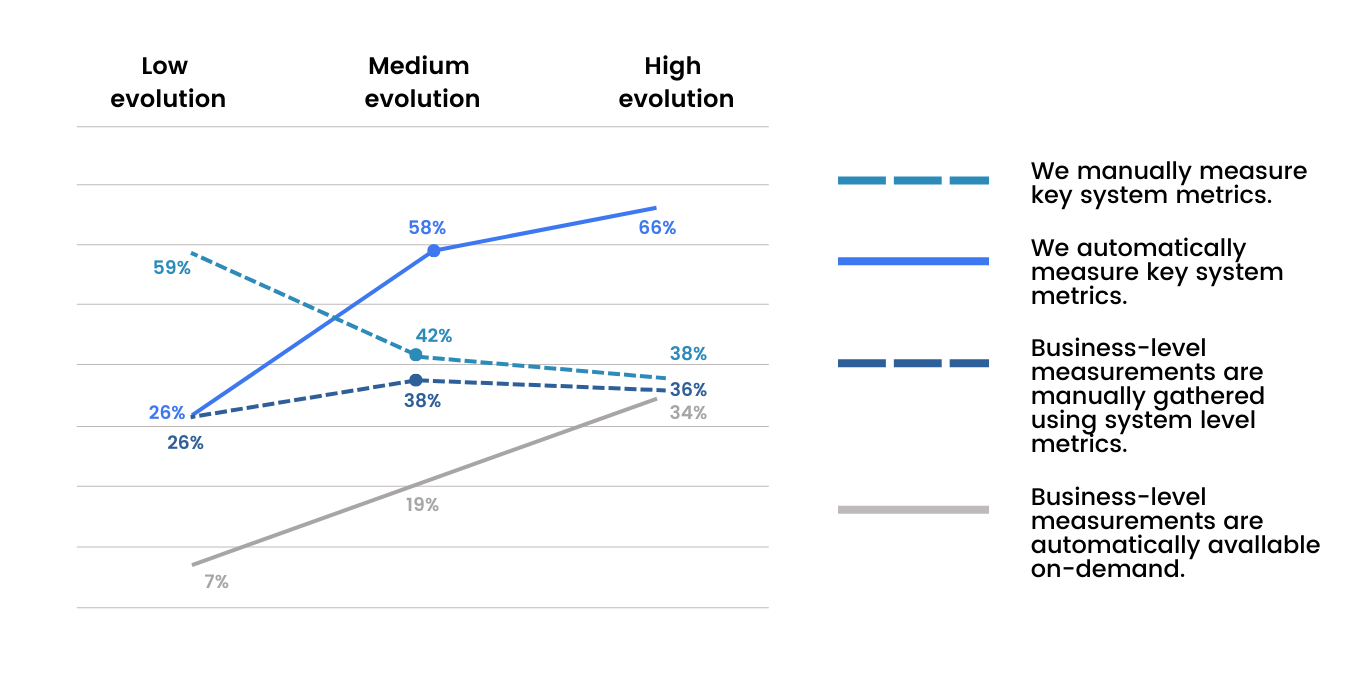
Automated measurement of metrics is a straight road to business growth (as the State of DevOps Report 2018 has shown)
DevOps breaks down these silos, promoting cross-functional collaboration, automation, and continuous improvement. Simply put, DevOps enables organizations to:
Accelerate Delivery: DevOps practices like Continuous Integration (CI) and Continuous Deployment (CD) allow for rapid and frequent releases, reducing time-to-market.
Enhance Quality: Automation of testing and deployment processes helps identify and rectify issues early in the development pipeline, resulting in higher-quality software.
Improve Stability: By automating infrastructure provisioning and management, DevOps reduces the risk of configuration-related errors and downtime.
Increase Efficiency: Streamlining processes and eliminating manual tasks frees up resources, enabling teams to focus on innovation and strategic initiatives.
But let’s clarify one more sore point.
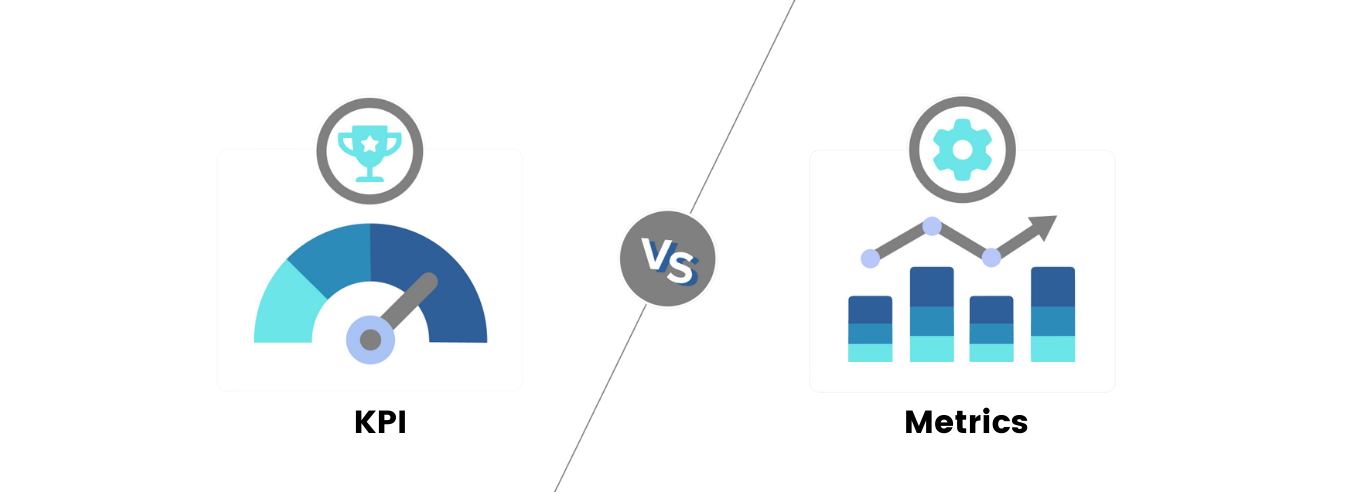
DevOps KPIs and Metrics: The Same Or Not The Same
Measurement regarding DevOps is about gaining actionable insights into your software development and deployment processes. If you are not a tech specialist or not a marketer, for example, metrics and KPIs are the same to you. But if you are supposed to know the ropes of development and operations, you should comprehend the distinction between Key Performance Indicators (KPIs).
Differentiating KPIs and Metrics
Key Performance Indicators (KPIs) and metrics are often used interchangeably, but in the context of DevOps, they serve distinct purposes:
KPIs are strategic, high-level measurements that directly align with your organization's objectives. They provide a concise, often qualitative assessment of performance. For example, if an organization's goal is to enhance customer satisfaction, a relevant KPI might be the "Customer Happiness/Satisfaction Score."
Metrics, on the other hand, are the quantitative data points that underpin KPIs. They provide the raw data necessary to calculate KPIs. In the case of customer satisfaction, metrics might include "response time to customer inquiries," "system uptime," and "bug resolution time."
This differentiation is crucial for top-notch specialists because while KPIs offer a top-level view of success, metrics offer the granular details needed to understand the underlying factors contributing to that success or failure.
Characteristics of Effective DevOps Metrics
Metrics aren’t human, so in this case, we can talk about inequality — not all metrics are created equal. To be truly valuable, DevOps metrics should possess certain key characteristics:
Relevance: Metrics should be directly related to the DevOps practices and processes under assessment. Irrelevant metrics can lead to misinformed decisions and wasted resources. Here are a couple of examples here. Irrelevant: lines of code written, each team member productivity, code coverage. Relevant: Deployment Frequency, Lead Time, Change Failure Rate.
Specificity: Effective metrics are specific and well-defined. They leave no room for ambiguity. For instance, instead of a vague metric like "system performance," a specific metric like "average response time for critical transactions" provides more actionable insights.
Measurability: You can’t improve things that you can’t gauge. Metrics should be quantifiable and measurable over time. The ability to track changes and trends is essential for any improvement, whether it’s a process, product, or service. Measurability often involves setting baselines and benchmarks for comparison.
Actionability: A good metric should prompt action. If a metric reveals an issue or inefficiency, it should be clear how the organization can address it. For instance, if the deployment frequency metric shows a decline, it should lead to discussions about potential bottlenecks in the deployment pipeline.
Alignment: Perhaps the most critical characteristic, metrics must align with the overarching goals of the organization. Whether the goal is to increase revenue, reduce costs, or improve customer satisfaction, DevOps metrics should tie back to these objectives to demonstrate their impact on the business.
Incorporating these characteristics into your DevOps metrics ensures that you are not just collecting data for the sake of it but are actively using that data to drive positive change in your development and deployment processes.
Key Areas of DevOps Measurement
DevOps success hinges on the ability to measure and continuously improve various aspects of the software development and deployment lifecycle. Below we elaborated on key areas of DevOps measurement and the specific metrics that provide insights into their effectiveness.
Continuous Integration and Continuous Delivery (CI/CD) Pipeline
Metrics for pipeline efficiency play a pivotal role in DevOps, ensuring the smooth flow of code from development to production.
Deployment Frequency: Many devs name this metric as the most important among others. Perhaps, it’s because this indicator better than others shows continuous improvement of the final product. DF is used to track how often new code changes are deployed to production. It helps gauge how rapidly new features and bug fixes reach users.
Mean Time to Recovery (MTTR): Another paramount pointer. Perhaps, the second one in terms of importance. In the event of failures or incidents, MTTR measures the average time it takes to restore normal service. Crucial for maintaining system resilience.
Lead Time: Measuring the time it takes for code changes to move from commit to deployment helps identify bottlenecks in the development process.
You can assess the success of automated testing and deployment processes by monitoring also metrics like test coverage, test pass rates, and the percentage of automated deployments. For example, a decline in test pass rates may indicate a need for more comprehensive test coverage or improved test scripts.
The main point is that there are no obligatory metrics to monitor. Okay-okay, maybe, only a few.
Deployment and Release Management
Effective deployment and release management are essential for maintaining system stability and user satisfaction. Key metrics in this area are expanded below.
Deployment Success Rate: Tracks the percentage of successful deployments versus failed ones. It's vital for understanding the reliability of your release process.
Rollback Frequency: High rollback rates may signify issues with the deployment process or insufficient testing. Want to find your room for improvement? Then track rollbacks.
Change Failure Rate: This metric measures the percentage of changes that result in incidents or require rollbacks. A high change failure rate suggests a need for better testing and risk assessment.
Measuring the impact of releases on system stability and user experience can also involve metrics like system uptime, response time, and user feedback. For example, a sudden increase in user-reported issues following a release indicates potential problems.
Incident and Problem Management
When incidents occur, swift and effective response is critical. The way of risk and incident management is always pointing on the most professional specialists. This way, if you are treating yourself as a big cheese in your area, then you must know the ropes of managing unexpected situations. Regarding DevOps KPIs and metrics, that means the ability to track at least the following metrics.
Incident Detection: Measuring how quickly incidents are detected helps minimize downtime and customer impact.
Response Time: The time taken to respond to incidents is vital for containing and mitigating their effects.
Resolution Time: Tracking how long it takes to fully resolve incidents ensures minimal disruption and faster recovery.
In addition to these, it makes sense to mention existing of metrics for post-incident reviews and the implementation of preventive measures. Analyzing the root causes of incidents and identifying trends can help in proactively preventing similar issues in the future.
Infrastructure and Resource Utilization
Divide and conquer, the Romans said. But we say manage and conquer. Because competent distribution of resources is “the basis of the fundamentals.” And an efficient infrastructure, in this case, plays a key role in ensuring cost-effective DevOps practices. Metrics in this area include.
Infrastructure Provisioning Time: Measuring how quickly new resources can be provisioned is crucial for scalability and agility.
Resource Utilization Rates: Monitoring CPU, memory, and storage utilization helps optimize resource allocation and avoid over-provisioning.
Scalability Metrics: Assessing how well your infrastructure scales with demand ensures that you can handle increased workloads without performance degradation.
In cloud environments, metrics also focus on cost efficiency, tracking spending, and optimizing resource allocation to align with budgetary constraints. In complex situations, on the other hand, these metrics provide invaluable insights, enabling organizations to identify pain points, optimize processes, and ultimately enhance DevOps success.
Cultural and Collaboration Metrics Matter Too
Let’s face it, many people have a common ground about tech specialists. They say devs and other tech workers are short-tempered, introverted, and closed personalities. But, c’mon — this is bias. Tech people also need to collaborate, and even more than non-tech specialists. Because fostering a culture of collaboration and continuous improvement for them is paramount. This culture is reflected in various metrics that assess team collaboration and system reliability.
Team Collaboration Quality
Cross-functional collaboration is vital for any company’s department. We can compare it with any sports team. Let’s say it’s a football team, for example. If your defender doesn’t align with team strategy, chances are you will be taken apart. The same story with DevOps as it ensures that teams work harmoniously towards shared objectives.
Inter-Team Dependencies: Tracking the number and impact of dependencies between different teams. High dependency ratios can highlight coordination challenges that need attention.
Code Contributions: Measuring how frequently team members contribute code and collaborate on projects. It reflects the level of teamwork and shared responsibility.
Collaboration Tools Usage: Monitoring the utilization of collaboration tools like Slack, Teams, or project management software. High usage indicates effective communication and information sharing.
For example, if a development team frequently collaborates with the operations team to address infrastructure-related issues and reduces the time to resolve incidents, it indicates successful cross-functional collaboration.
Mean Time Between Failures (MTBF)
MTBF, a metric borrowed from reliability engineering, evaluates system reliability and stability over time. In DevOps, it reflects the effectiveness of practices such as automated testing, continuous monitoring, and proactive incident management.
MTBF calculates the average time between system failures or incidents. A higher MTBF indicates that the system is more stable and less prone to issues. For instance, if the MTBF of a web application is six months, it means that, on average, the application can run for six months before experiencing a critical incident.
The significance of MTBF lies in its ability to identify trends. An increasing MTBF suggests that DevOps practices are successfully preventing failures, while a decreasing MTBF may signal the need for process improvements or more robust testing. By monitoring MTBF alongside other metrics, organizations can ensure that their DevOps practices not only enable rapid development but also maintain the stability and reliability of their systems.
Business Impact Metrics
When it comes to measuring the success of DevOps practices, business impact metrics take center stage, providing insights into how DevOps affects the bottom line and strategic goals of an organization.
Time-to-Market
Measuring time-to-market is a critical business impact metric that assesses the speed at which new features or updates are delivered to end-users. DevOps, with its emphasis on automation and continuous delivery, significantly impacts this metric. For example, a company that previously took months to release a new software version can now do so in a matter of weeks or even days, gaining a substantial competitive advantage. Reduced time-to-market means staying ahead in a fast-paced market, meeting customer demands promptly, and capitalizing on emerging opportunities.
Customer Satisfaction
Customer satisfaction is the lifeblood of any business, and DevOps can play a pivotal role in enhancing it. The main measure you can take in this area is to collect customer feedback. Then — calculate Net Promoter Scores (NPS) and user adoption rates. By collecting and analyzing this data, organizations can gauge the success of their DevOps practices in delivering a better user experience.
For instance, if the NPS score increases after the implementation of DevOps, it indicates that the organization's efforts in improving its software development and delivery processes are positively impacting customer loyalty. This linkage between DevOps practices and customer satisfaction underscores the direct connection between operational excellence and business success.
Return on Investment (ROI)
Calculating the return on investment (ROI) is a fundamental metric for assessing the financial benefits of DevOps implementation (of any implementation, by the way). It involves measuring cost savings, revenue, and overall business growth resulting from DevOps practices. Or vice versa, if the new approach or tool isn’t worth further using — give it up.
For example, reduced manual intervention and automation in deployment processes can lead to substantial cost savings. Additionally, faster time-to-market can result in increased revenue as new features and updates reach customers sooner. A positive ROI demonstrates that DevOps is not just a technical endeavor but a strategic investment that contributes to the organization's financial well-being and long-term growth.
Tools and Technologies for DevOps Measurement
Tools, tools everywhere. To be more serious, effective DevOps measurement relies on the use of instruments and technologies designed to collect, analyze, and visualize data from various stages of the software development lifecycle.
Monitoring and Analytics Tools
Monitoring tools are essential for collecting and visualizing DevOps metrics. They provide real-time insights into the performance of systems, applications, and infrastructure. Examples of such tools are below.
Prometheus: An open-source monitoring and alerting toolkit designed for reliability and scalability.
Grafana: A popular platform for creating interactive and customizable dashboards for monitoring data.
ELK stack (Elasticsearch, Logstash, Kibana): A set of tools for collecting, parsing, and visualizing log data.
New Relic: A comprehensive observability platform that offers application performance monitoring, infrastructure monitoring, and more.
Automation Platforms
Automation is a cornerstone of DevOps practices, and automation platforms play a crucial role in accurate metric collection. These platforms streamline processes, reduce manual intervention, and ensure consistency. Some key automation tools for DevOps measurement are listed here:
Jenkins: An open-source automation server that facilitates building, testing, and deployment automation.
Ansible: An automation platform that simplifies configuration management, application deployment, and task automation.
Kubernetes: An open-source container orchestration platform that automates the deployment, scaling, and management of containerized applications.
To sum it up
DevOps has emerged as a transformative force, ushering in an era of rapid delivery, enhanced quality, and improved collaboration. At the heart of this revolution lies the crucial role of DevOps KPIs and metrics. These metrics provide a quantifiable lens through which organizations can gauge their DevOps success, transcending vague notions of improvement.
DevOps KPIs enable organizations to not only measure their current state but also pave the path towards continuous improvement. Metrics are also the compass guiding decisions and fostering a culture of adaptability and efficiency. By closely monitoring particular indicators from the article, organizations can identify bottlenecks, optimize processes, and align DevOps practices with overarching business objectives.
The message is clear: DevOps is not just about implementation; it's about refinement. As organizations embark on their DevOps journey, it is imperative to adopt a well-defined set of metrics tailored to their unique goals and challenges. By doing so, they can ensure that their DevOps practices are not only successful today but also adaptable and resilient in the face of tomorrow's challenges.